NEW YORK (CNNfn) - In 1998 Wall Street drove a Ferrari. In 1999 the car of choice may be a Chrysler minivan.
After a year of hair-raising climbs and falls, market bulls appear ready to settle for a steadier ride with fewer sharp turns and less dizzying speeds, but the market direction seems set from the start -- onward and upward.
As the final closing bell of the year rang on the New York Stock Exchange Thursday, the Dow Jones industrial average marked off its fourth straight year of double-digit gains, the Nasdaq Composite settled at an all-time high, and Wall Street's stentorian gurus were back predicting 1999 would be another year of steady, albeit less staggering, returns.
What's in store for 1999
Through much of 1998, fickle investor attitudes and the equally capricious views of market experts seemed in competition for the fastest and most dramatic change every time Wall Street took a different turn.
At the dawn of the new year, however, most stock gurus appear to agree that 1999 promises to be another bull market year, even if the bull may be much tamer than in the past three years. Many see the Dow piercing through 10,000 in the first half of the year, but just as many see the blue chip index ending 1999 with only a single-digit percentage gain.
Among the market's most spirited forecasters, Ralph Acampora, the flamboyant chief technical analyst at Prudential Securities, sees the Dow climbing as high as 11,500 under the best of circumstances. But Acampora -- who started 1998 as a fierce bull, turned heavily bearish at mid-year and reverted to a more reserved bullish outlook during the market's October recovery -- also sees the Dow potentially falling as low as 7,800 in the new year.
In other words, Acampora is hedging his 1999 forecast by predicting a broad trading range for the market -- 7,800/8,450 on the downside and 9,800/11,500 on the upside for the Dow -- a market in which careful stock pickers, rather than trend investors, are likely to do better.
"I think there are going to be a lot of bumps along the way," Acampora said in an interview with CNN's "Moneyline News Hour with Lou Dobbs." (264K WAV) or (264K AIFF)
Cohen also bullish in 1999
Another one of Wall Street's leading fortune tellers, Goldman Sachs' Abby Joseph Cohen, whose prediction that the Dow industrials would finish 1998 at 9,300 missed by just more than 100 points, also has kept her bull horns on for the new year. But, like other analysts, Cohen is forecasting more modest market growth in 1999 -- she sees overall stock gains of about 10 percent for the year. (1.7M QuickTime Movie)
"The global backdrop in 1999 will continue to offer impediments, but we expect Supertanker America to stay its course of moderate economic and profit growth," Cohen wrote in her 1999 outlook research report.
Her target for the Dow industrials is 9,850 and 1,275 for the S&P 500 -- only about 45 points away from the index's 1998 year-end level.
Somewhere in the middle between Acampora's wide-range predictions and Cohen's cautious optimism comes the moderately bullish outlook of A.G. Edwards' market strategists.
"We are maintaining our long-standing target for the Dow 10,000 area by late spring 1999," Stuart Freeman, the firm's chief equity strategist, wrote in his 1999 outlook.
Low interest rates, tame inflation and healthy consumer spending are likely to provide a solid underpinning for the economy and the stock market, while lingering convulsions in southeast Asia would continue to dampen growth, Freeman wrote.
Much of the market's performance, of course, will depend on the earnings power of U.S. corporations -- and the outlook there, though still rosy, is of a much paler hue than last year's.
According to First Call, a firm that tracks analysts' earnings expectations, overall profit growth for the companies in the S&P 500 index is likely to reach 18.6 percent in 1999, well above 1998's projected 2.4 percent, but a number that is likely to suffer some drastic reductions as the year progresses.
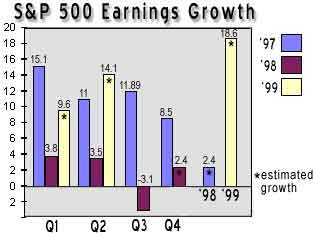
In fact, despite robust earnings growth projections for the first half of the year by market analysts, Charles Hill, First Call's director of research, expects to see negative numbers in the first and second quarters.
"We'll probably be in negative territory for growth when all is said and done," Hill said.
According to Hill, most of the growth in corporate profits is likely to occur in the last two quarters of the year.
Market of the small-time bull
Much of Wall Street's 1998 gains came as a result of the optimism and persistence of individual investors -- Americans building their nest eggs, saving for retirement, for their children's college education or simply for a better life. Those who stayed in the market when it took its summer plunge and who poured money into stocks throughout the year are ready for more in 1999.
"This is the best economy I have seen in my lifetime," wrote one respondent to a CNNfn.com poll. "... I see no reason to think that the [market] outlook for '99 will change much. The U.S. is stable and all the fundamentals are excellent. We are on top of the world!"
More than two thirds of the poll's respondents believe the Dow industrials will end the year between 9,000 and 11,000 and most of them believe that number will be somewhere above 10,000. Nearly 40 percent of those who answered the poll see the Nasdaq Composite climbing above 2,500.
"I plan to continue drinking Coca Cola, eating food from sources other than my garden, wearing clothes, seeking health care and driving to and from work and pleasure. My household alone will help the market rise, especially by the time I plan to retire!" another of the poll's respondents wrote.
1998 in numbers
At the start of 1998, it looked as if the longest-running bull market in history was in for another stretch of spectacular ascent.
By mid-year, it appeared that the bears had finally woken up, prompting even some of the stock market's staunchest optimists to issue grim predictions and send investors scrambling for the exits as the Asian crisis loomed large and ricocheted through Russia and Latin America.
In the end, all was forgiven and forgotten.
The Dow Jones industrial average, Wall Street's blue chip weather gauge, ended 1998 at 9,181.43. That is 1,273 points, or 16.1 percent, above where the index started the year, a solid increase that masks a rough ride through dizzying climbs and head-spinning falls as the U.S. stock market fought its way through economic crises around the world, a threat of recession at home and a rate-cutting rescue mission by the Federal Reserve.
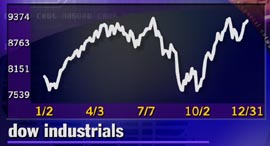
During the course of the year, the Dow set 30 record highs, culminating in a climb to 9,374.27 on Nov. 23.
A healthy U.S. economy, strong investor confidence and a vast cash inflow into the market sent the index up more than 12 percent during the first three months of the year, a bullish trend that stalled in the early summer and took a sharp turn for the worse in August and September.
Within weeks the Dow erased all its gains for the year, and on Aug. 31 took its second worst one-day tumble in history, losing 512.61 points in a single trading session.
A week later, however, the bulls were back, giving the blue chip index its biggest rally ever and lifting it 380.53 points in one day on Sept. 8. The following two months, October and November, marked one of the steepest climbs in the market's history as the Dow surged almost 23 percent between Oct. 1 and Nov. 23, the day it set its latest record.
In the midst of its roller-coaster ride through the year, the Dow also managed to sneak in a day without any change, closing at 8,706.15 on Nov. 3, the same as the day before.
Meanwhile, the Nasdaq Composite, heavily weighted with technology and Internet issues and a broad indicator of the health of these hottest market sectors, set some 36 records of its own in 1998. The latest, on Dec. 31, took the Nasdaq up to 2,192.69.
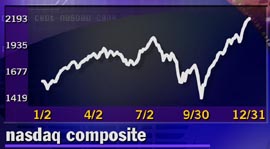
The Nasdaq also enjoyed its three largest one-day point gains on Sept. 8, Sept. 1 and Oct. 9, and its worst tumble in history, together with the rest of Wall Street, on Aug. 31.
The index finished the year 622 points, or 39.63 percent, higher at 2,192.69.
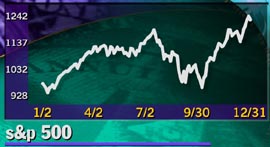
The S&P 500, Wall Street's broadest indicator for large-cap stocks, was by far the most prolific record setter, climbing to a new high 47 times in 1998. Sept. 8 marked the S&P 500's biggest one-day point gain, and Aug. 31 brought the index's worst one-day tumble. After peaking at 1,241.81 on Dec. 29, the S&P 500 ended the year 26.67 percent higher at 1,229.23.
While the stocks of blue chip powerhouses plowed ahead and lifted the Dow, the Nasdaq and the S&P 500 to new heights, the Russell 2000, Wall Street's measure of small cap stocks' performance, was left behind in the dust. The index peaked at 491.40 on April 21, then slumped through the summer and never quite recovered during the rest of the year.
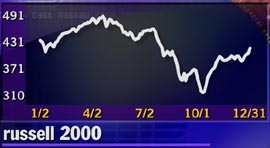
The Russell 2000 finished the year with a 3.45 percent loss at 421.96. 
-- by staff writer Malina Poshtova Zang
|