|
Gloom gathers for bonds
|
 |
June 11, 1999: 3:46 p.m. ET
Retail data, rumors and ambivalent PPI lead yield up to 19-month high
By Staff Writer Robert Scott Martin
|
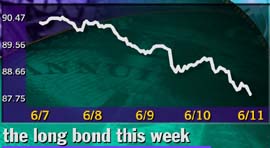
NEW YORK (CNNfn) - Bond prices tumbled Friday, pushing the yield to the highest level in 19 months as traders focused on rumors, a sliding dollar and ambivalent economic data.
Shortly after 3 p.m. ET, the bellwether 30-year Treasury bond lost 1-5/32 points in price to 87-24/32, while the yield surged to 6.15 percent, a closing level not seen since Nov. 7, 1997.
Other Treasury securities were likewise deep in negative territory, with the 10-year note yield edging up past 6 percent for the first time in 20 months during the session.
The losses brought the bond's slide for the week to more than two full points, or $20 per $1,000 of face value. The yield surged a full 19 basis points.
Any excuse to sell
The bond market's overwhelmingly gloomy sentiments kept traders on the defensive throughout the day, jumping at shadows and seeing omens of disaster at every turn.
Unsubstantiated rumors spread through the market, adding to the oppressive atmosphere. In particular, speculation ran high that the Federal Reserve was holding an emergency meeting, either to vote on interest rates or to rescue an ailing hedge fund. Although Fed spokesmen later discounted this, the apocalyptic nature of the rumors reflected the market's overall tone.
Tiger Management, identified by some reports as the putative "ailing fund," told CNNfn.com that the speculation was "absolutely untrue" and "absurd."
PPI gives no comfort
More fundamentally minded investors were unimpressed and increasingly disappointed by the May producer price index (PPI), which showed wholesale inflation rising 0.2 percent, exactly on target with expectations.
However, the bond market focused on the bearish elements of the report, notably the crude goods component of the index, which climbed 5.5 percent, its sharpest increase since late 1996.
The crude goods PPI figure indicates the price of products coming down the pipeline into the consumer sphere, indicating a substantial inflation increase ahead.
Waiting on the Fed
Investors had hoped the data would offer new insight into Wednesday's eagerly awaited consumer price index (CPI), which investors hope will in turn be the key to second-guessing the Federal Reserve's next decision either to raise U.S. interest rates or leave them unchanged.
Rumored emergency meetings to the contrary, the Fed's rate-setting Open Market Committee (FOMC) is next set to meet June 29-30. Since the FOMC adopted a bias toward higher rates, financial markets have waited for the CPI to see whether last month's unexpected spike in inflation was an isolated incident or the start of a new pro-inflationary trend.
If the upcoming CPI defies the PPI figures and shows that inflation remains alive and well in the economy, the FOMC is more likely to step in to raise rates in response. Higher interest rates artificially curb inflation by slowing economic growth, strangling inflationary pressures generated by expansion.
When the Fed does vote to raise rates, the cost of borrowing money to invest or make large purchases will increase in response, depressing the stock market's recent ebullience and pushing bond yields higher, at least at first.
Retail hurts bonds
Meanwhile, retail sales figures for May, which showed sales surging 1 percent from a lackluster 0.1 percent gain in April.
Because the upturn was higher than the 0.8 percent increase bond traders had expected, the news encouraged some investors to trim their fixed-income portfolios even further.
Robust retail sales indicate that consumers are still driving the economy to expand at a fast pace. Because the consumption, or retail, component of the economy is the main focus of the CPI, some investors fear that the CPI still may come in dramatically higher than expected even though the PPI remains flat.
Dollar slides again
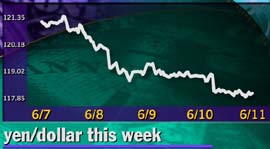
Dollar bulls got little comfort from the data, suffering instead only a day after Japan's sudden escape from recession Thursday sent the yen dangerously higher on the greenback and prompted the Bank of Japan to buy dollars.
On Friday, the dollar was back on the skids, edging back down to 118 yen and raising fears that the BOJ could intervene again next week to keep currency values in line.
Japanese monetary officials repeatedly have warned that too much strength in the yen isn't in their nation's best interests, as a strong yen will hurt exports and endanger a fragile ongoing economic recovery.
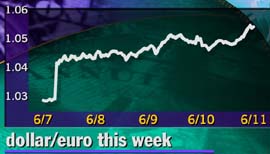
The euro took advantage of the dollar's loss of upward momentum against the yen, climbing to $1.0535 in early U.S. trading as investors increasingly locked in the prospect of peace in Kosovo.
The three-month armed conflict between NATO and Yugoslav forces in Kosovo, on the doorstep of united Europe, kept persistent downward pressure on the European currency, helping force it to successive lifetime lows. 
|
|
|
|
|
 |

|