|
Asia suffers flat session
|
 |
November 5, 1999: 10:17 a.m. ET
Nikkei's tepid close sets tone for subdued trading across most of region
|
LONDON (CNNfn) - Asia's markets ended Friday in a subdued mood, as investors shored up their positions ahead of the weekend, after strong gains in recent sessions. Japanese blue chips ended flat Friday with tech stocks providing the main support.
Tokyo's Nikkei 225 index ended just 7 points higher at 18,354.90 as investors opted for caution after Thursday's strong rally. The index has gained 2.3 percent over the week. Only technology stocks showed much strength, after another record close on the Nasdaq composite overnight.

U.S. tech stocks led the way again on Wall Street, as the tech-heavy Nasdaq closed almost 1 percent higher at 3,055.95. The Dow Jones industrial average managed a modest 30 point gain to close at 10,639.64.
The U.S. tech stocks helped their Japanese counterparts. Telecom giant NTT jumped just over 3 percent to close at ¥1.7 million, Sony Corp. rose 2.3 percent to end at ¥17,050, while Internet investor Softbank Corp. closed 2.4 percent higher at ¥46,900.
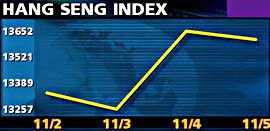
In Hong Kong, the Hang Seng index closed down 41 points or 0.3 percent at 13,610.27, as a subdued session took a hit from a surprise loss by heavyweight Cable & Wireless HKT. The telecom group shocked the market when it posted a half year loss of HK$2.8 billion, after taking an exceptional charge for write-offs.
Hong Kong blue chips have risen 2.7 percent over the past week.
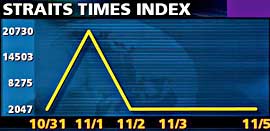
In Singapore, the Straits Times index recovered marginally from a mildly negative session, as it closed less than 2 points higher at 2,111.55.
Investors stepped back from market after strong gains in recent sessions, which has seen it add rise more than 3 percent over the week.
There was added caution in the market ahead of a long weekend, with the market closed Monday.
South Korea's Kospi closed just inside the plus column at 913.09, a gain of 1 point, as local investors sold on the back of Thursday's rally and overseas institutions recent buying spree weakened.
Australian blue chips were also hit by a mild sell-off as the All Ordinaries closed down 16 points at 2,919.8, ending a six-day winning streak.
Taiwan's Weighted index managed small gains to close 19 points higher at 7,488.26, while the Composite in Manila ended down 0.4 percent at 2,018.41.
Kuala Lumpur blue chips slipped further into negative territory in late trade to close almost 0.9 percent lower at 721.35.
The JSX in Indonesia staged a late rally to close 1.2 percent higher at 626.04.
Thailand's Set in contrast reversed a strong position in late afternoon trade to close down 0.3 percent at 418.47.
-- from staff and wire reports
|
|
|
|
|
 |

|