NEW YORK (CNNfn) - Call it the week the bond market turned upside down, literally.
Analysts estimate that some of the nation's largest bonds dealers suffered substantial losses over the last few days. But it's not because bonds fell. It's because they rose.
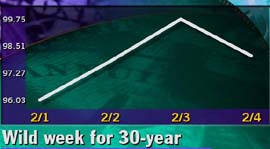
Buoyed by the first budget surpluses in a generation, the Treasury Department said it will reduce the amount of money it borrows. Investors responded by snapping up the government's shrinking supply of long-term debt in a frenzy that sent the price of the staid 30-year bond soaring like a like a dot.com stock.
When the dust finally settled, some traders were left wondering what hit them.
"When you see those kinds of movements...you have to worry that folks are taking some pain," John Lipsky, chief economist at Chase Manhattan Bank told, CNNfn's Ahead of the Curve Friday. "There's a lot of folks caught in difficult situations."
Indeed, institutions that bet bond prices would fall, or gambled that yield spreads between differing securities would narrow, scrambled to cover their wrong-headed bets. The panic didn't stop after the Federal Reserve Bank of New York took the unusual step of denying rumors that it held an emergency meeting to discuss the financial losses.
Jim Bianco, head of BiancoResearch.com, said the panic and losses illustrate Wall Street's increasing reliance on elaborate bets involving the relationships between yields of different securities. (544K WAV) (544K AIFF). He also estimated the blood letting caused real pain. (422K WAV) (422K AIF).
"These various bets were clearly wrong-headed," said Tony Crescenzi, bond strategist at Miller Tabak & Co. "But on the other side of the trade, someone made money."
Blame the economy
A surge in tax receipts brought on by an economy in its record 107 month expansion has allowed the Treasury to issue fewer bonds, lowering the upcoming quarterly refunding to $32 billion. The agency also said it will purchase some of its outstanding securities.
The news sent the 30-year bond soaring an extraordinary 3 percent at one point Thursday, pushing its yield -- which moves in the opposite direction of the price -- to the lowest level since November.
�"This is just a buying panic in the long end of the curve," said Mike Ryan, senior bond analysts at Paine Webber. "People are concerned about the supply levels."
The curve inverts
The year's lowest yields on the 30-year bond have varying consequences. Analysts say it could bring on a surge of corporate bond issuance, as companies look to lock-in low borrowing cost. Mutual funds investing in long-term bonds, meanwhile, could stand to gain. PIMCO's Long Term Government Bond Fund jumped 0.9 percent Thursday, nearly doubling its gains for the year.
The bond gains have also led to an inverted yield curve, when shorter-term securities, like bills and notes, yield more than bonds, whose maturities are longer. The development is unusual, because investors typically demand higher yields on longer-term debt to compensate for the risk that inflation will erode the value of their holdings over time.
"What the Treasury has done has caused a significant, permanent shift in the way the curve is structured," said Kim Rupert, markets analyst with Standard & Poor's MMS in San Francisco. "We'd seen a lot of subtle changes beforehand but it was the announcement this week that really triggered the earthquake."
Historically, an inverted curve signals an economic slowdown. But analysts call the current inversion a symptom of demand exceeding supply.
The bond gains have also dethroned the 30-year's benchmark status. The 10-year note, less subject to the week's buying mania, is now considered the better benchmark of inflation expectations.
Bonds fall on strong job data
The 10-year note fell 21/32 to 96-5/32 Friday. Its yield rose to 6.54 percent from 6.45 percent Thursday. The losses came after the latest evidence of the economy's strength fanned fears of more Federal Reserve interest rate hikes ahead.
The government reported surprisingly strong job growth and record low unemployment for last month.
The Labor Department said 387,000 non-farm jobs were added to the economy in January, nearly double forecasts. Average hourly earnings rose 6 cents, above expectations, to $13.50. And the unemployment rate slipped to a 30-year low of 4 percent.
"That's a pretty strong unemployment number," said Bruce Alston, who manages $1.5 billion in bonds for Value Line Asset Management. "It's putting a lot more pressure on the (Federal Reserve) to raise interest rates."
Friday's jobs data may only give the Federal Reserve more reason to raise rates to slow the economy and pre-empt rising inflation.
The nation's central bank Wednesday raised short-term interest rates by a quarter point to slow the U.S. economy and pre-empt rising inflation.
The move to increase borrowing costs is the Fed's fourth effort since June to tap the brakes on an economy in a record expansion. But despite the Fed moves, consumer spending and confidence are strong, unemployment is at a 30-year low, and soaring stock markets have created trillions of dollars in paper wealth.
As such, analysts say Fed inflation fighters still have work to do.
Value Line's Alston notes that in a sense the Fed has taken only one crack at slowing the economy. That's because the three rate hikes last year merely reversed the cuts the central bank made in 1998 to insulate the economy from the Asian financial crisis.
Alston sees at least one and as many as three more credit tightenings. 
|