|
Venture funding snowballs
|
 |
February 14, 2000: 12:39 p.m. ET
Investment in Internet biz pushes venture capital funding to $35.6 billion in 1999
|
NEW YORK (CNNfn) - Venture capital investments in U.S. companies exploded in 1999 to a record $35.6 billion, according to a report Monday. Far from a democratic distribution of wealth, however, the vast majority of that money flowed to high-tech companies based in California's Silicon Valley.
The PricewaterhouseCoopers venture capital survey revealed that venture capital funding more than doubled in 1999 from a total of $14.2 billion during 1998.
"The amount is really incredible, but not completely surprising," said John Volk, director of venture capital and private equity group of the global technology industry group of PricewaterhouseCoopers. "We have seen steady growth in venture capital funding because the opportunities are viewed to be enormous."
The allure of the Internet
Technology companies snatched 90 percent of all investments in 1999. Investment in the sector, which was dominated by Internet-related investments, tripled to $32.4 billion in 1999 from $10.8 billion in 1998.
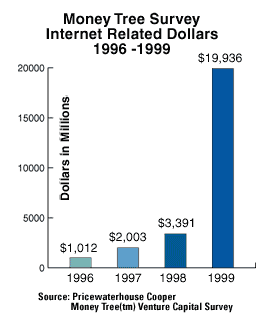
Internet-related companies, interesting to investors in years past became irresistible in 1999. Internet-related investments, increased from $3.4 billion in 1998 to an astounding $19.9 billion last year, accounting for more than 56 percent of all investments in 1999.
"Technology in general and the Internet in particular are entirely responsible for the increase," noted Paul Weaver, chairman of PricewaterhouseCoopers global technology industry group. "A solid U.S. economy, a sensitive but wildly volatile stock market, and a receptive, though selective, IPO market, combined with the ever-expanding opportunities for technology, create an ideal environment for venture capitalists and entrepreneurs alike."
Most venture capital investors tried to capitalize on the boom in e-commerce businesses. Both business-to-consumer and business-to-business e-commerce companies experienced dramatic investment increases; the business-to-consumer sector soared 1,092 percent, while B2B notched a 908 percent gain last year.
Given the high level of interest in high tech, it comes as no surprise that Silicon Valley far outpaced every region in the amount of venture capital it attracted. Venture capital firms poured $13.4 billion into businesses based in Silicon Valley in 1999. New England firms came in a distant second place with a total of $4.1 billion, and the New York metropolitan area received $2.5 billion in venture funding. The Southeast netted $2.46 billion, followed by the Los Angeles/Orange County area, which garnered $2.36 billion.
Venture funds log strong gains
Driving the dramatic increase in venture capital funding, Volk said, is recognition on the part of both institutional investors and high net worth individuals that there are strong gains to be made in venture funding.
Indeed, research compiled by Thomson Financial Securities Data's Venture Economics, which tracks the performance of over 1,200 U.S. venture capital and buyout funds, shows that venture funds have logged strong performances in recent years.
All venture capital funds, as of the third quarter of 1999, averaged 62.5 percent one-year returns. The highest performing venture funds, early seed venture capital funds, averaged one-year returns of 91.2 percent in the same study.
"There has been an increased appreciation for the fact that venture capital is a viable investment from an institutional and high-net-worth individual standpoint," Volk said. "It has been gradual, but it has picked up rather dramatically in the last year." 
|
|
|
|
|
|
PricewaterhouseCoopers
|
Note: Pages will open in a new browser window
External sites are not endorsed by CNNmoney
|
|
|
|
 |

|