|
Home prices rose last year
|
 |
March 9, 2000: 3:10 p.m. ET
Good news for homeowners as prices rise more than 6% for 1999
By Staff Writer Alex Frew McMillan
|
NEW YORK (CNNfn) - Home prices continue their steady rise on the back of the strong U.S. economy, according to home-loan financier Freddie Mac. They are increasing at more than twice the rate of inflation, and that means homeowners are seeing a real growth in the value of their homes.
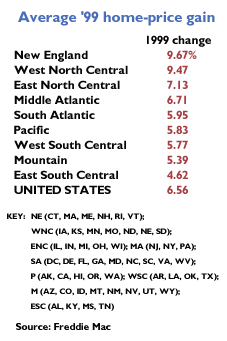
U.S. home prices averaged a 6.6 percent boost nationwide last year, Washington, D.C.-based Freddie Mac reported in its Conventional Mortgage Home Price study, which it released this week. With inflation at around 2.5 percent for 1999, homeowners saw a return of about four percentage points.
Homeowners getting good returns
"That's a very healthy return," Freddie Mac senior economist Amy Cutts said. "If you can make one or two percentage points above [inflation] and still live in your house, you're making some very nice gains."
 The higher prices make it a little more difficult for new homeowners to get into the market. Faced with higher mortgage rates, which have risen substantially over the last year, new homebuyers may hold off, hoping to build up a bigger down payment and reduce the price of their mortgage. The higher prices make it a little more difficult for new homeowners to get into the market. Faced with higher mortgage rates, which have risen substantially over the last year, new homebuyers may hold off, hoping to build up a bigger down payment and reduce the price of their mortgage.
But unless there's a drastic change in the economy, Cutts said the increase in home prices shouldn't put off prospective buyers.
"Part of the purchasing decision for buying a house is an expectation of what housing prices are going to do in the future," Cutts said. "It's true that houses are getting more and more expensive, but people are increasing their wealth in ways we haven't seen in a while." That has contributed to consistently higher home values.
High consumer confidence, low unemployment, real increases in wages and productivity, all have led to a sustained boom in the housing market. The growth rate for home values showed steady increases in the years after the recession in the early '90s. That growth curve has now leveled off but the growth is still steady, staying between 5 percent and 6 percent each year during the last four years.
Regional differences not too great
New England posted the best one-year gain in home prices. In those states -- Connecticut, Massachusetts, Maine, New Hampshire, Rhode Island and Vermont -- homes jumped 9.7 percent last year.
The Midwest and Northwest were the next-strongest housing markets in 1999. A region called the West North Central -- comprised of Iowa, Kansas, Minnesota, Montana, Missouri, Nebraska and North and South Dakota, according to the Census Bureau -- is where home values rose the fastest in the fourth quarter, the most recent period measured.
If you annualize the home-price increase for the fourth quarter, that region closed the year with prices growing at a 9.3 percent annual rate. Freddie Mac characterized that as "spectacular growth."
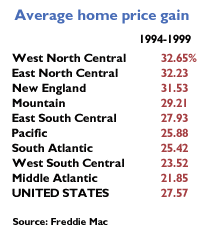
 Over the last 12 months, home prices rose 1.5 times as much there as in the rest of the country, as they did in New England, averaging a 9.5 percent increase. For the last five years, homes have gone up the most in the West North Central compared with any U.S. region, increasing 32.6 percent, or almost one-third. Over the last 12 months, home prices rose 1.5 times as much there as in the rest of the country, as they did in New England, averaging a 9.5 percent increase. For the last five years, homes have gone up the most in the West North Central compared with any U.S. region, increasing 32.6 percent, or almost one-third.
The Pacific region -- Alaska, California, Hawaii, Oregon and Washington -- was the next-best performer last year, with homes increasing 5.8 percent in the 12 months through December 1999.
But for long-term growth rates, the East North Central states -- Illinois, Indiana, Michigan, Ohio and Wisconsin -- have the second-best growth rate behind the West North Central. Home prices rose 32.2 percent over the last five years.
New England isn't far behind in third place. For the last half a decade, New England homes rose 31.5 percent.
Wealth spread more evenly than normal
The positive side of the regional differences is that the gap between the top-performing region and the lowest-performing region is much smaller than it had been in the past. The states in the East South Central region -- Alabama, Kentucky, Mississippi and Tennessee -- were the furthest behind the rest of the United States last year. Home prices went up 4.6 percent there.
But that is still substantially above the rate of inflation, Cutts pointed out, meaning those states were simply the worst of a good bunch. Homeowners there still got a return in the investment in their homes.
In the '70s and the '80s, the worst performing housing markets lagged inflation, Cutts said, even in previous boom housing markets. That meant homeowners lost value in their homes.
Though New England outdid the East South Central by just over 5 percentage points in 1999, the gap between the top performer and the laggard has been as high as 30 points in the past.
There is also a lot of movement among the growth-rate ranking from quarter to quarter, meaning no one region of the country is constantly stuck in the home-price cellar.
"The benefits have been really widespread," Cutts said. "Who is in first place one quarter might be in second place next and last place down the road." The wealth wasn't spread as evenly or as widely before, she explained.
The fact that homes are increasing so rapidly in the West North Central region reveals that traditional farming and manufacturing states, such as Iowa, Missouri, Minnesota and North Dakota, are succeeding in transforming themselves into service-oriented states, Cutts said.
Market coming off highs
The housing market and housing prices did slow in the fourth quarter of 1999 compared with the third, and the fourth-quarter average increase of 6.4 percent was slightly below the average for the year. New-home sales have also dropped off.
"I do think that higher mortgage rates have dampened the market," Cutts said. "But it is coming from highs." The third quarter was unexpectedly strong. Some of the difference may also be seasonal, Cutts said, with heavy snowfalls tending to discourage shopping for homes during the winter in northern states.
Freddie Mac (FRE: Research, Estimates), officially called the Federal Home Mortgage Corp., is a publicly traded company that was set up by Congress in 1970. It buys mortgages from banks, bundles the loans, then sells them as mortgage-backed securities.
The agency thinks its home-price survey is a better gauge than other home-price surveys because it is a "repeat-sale" index. In other words, it measures the change in price of specific houses versus their previous value, rather than looking at overall averages of activity.
When a house is sold or a mortgage is refinanced, Freddie Mac compares the value of the house with its old price. It now has 11.9 million such "matched pairs" in its index since it began the measure in 1975. 
-- Click here to send email to Alex Frew McMillan
|
|
|
|
|
 |

|

