graphic
News > International
Thomson back in the black
March 15, 2000: 5:35 a.m. ET

Earnings rebound as defense, telecom activities beat expectations
graphic
graphic graphic
graphic
LONDON (CNNfn) - Thomson-CSF on Wednesday unveiled better-than-expected full-year earnings for 1999 as the benefits of the defense contractor's diversification into civil electronics began to bear fruit.
    Thomson, Europe's largest defense electronics company, posted net income of 275 million euros ($266 million), bouncing back from a 232 million-euro loss in 1998 as restructuring charges dropped to 70 million euros from 314 million. According to Reuters, analysts had predicted net income would rise to 260 million euros.
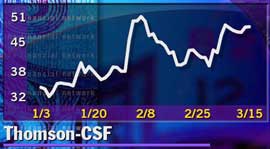
    Investors had been primed for strong earnings following an optimistic presentation to investors last month. Thomson (PHO) stock rose only mildly to 48.66 euros in early Paris trading. The stock has risen some 50 percent so far this year.
    In an upbeat assessment of the outlook for 2000, Thomson predicted continuing growth in orders, after a 15 percent increase to 15.4 billion euros in 1999.
    graphic Earnings per share for 1999 were 1.65 euros, compared with a loss of 1.60 euros per share in 1998.
    Operating profit rose 10 percent to 390 million euros. The defense business generated operating profit of 243 million euros, aerospace chipped in 48 million and the rest came from civil telecom businesses.
    Revenue rose 12 percent to 6,9 billion euros, as previously reported in early February. Back to top

  RELATED STORIES

French defense group surges - Feb. 02 , 2000

Thomson swallows Racal - Jan. 13 , 2000

  RELATED SITES

Thomson-CSF


Note: Pages will open in a new browser window
External sites are not endorsed by CNNmoney


graphic

Most stock quote data provided by BATS. Market indices are shown in real time, except for the DJIA, which is delayed by two minutes. All times are ET. Disclaimer. Morningstar: © 2018 Morningstar, Inc. All Rights Reserved. Factset: FactSet Research Systems Inc. 2018. All rights reserved. Chicago Mercantile Association: Certain market data is the property of Chicago Mercantile Exchange Inc. and its licensors. All rights reserved. Dow Jones: The Dow Jones branded indices are proprietary to and are calculated, distributed and marketed by DJI Opco, a subsidiary of S&P Dow Jones Indices LLC and have been licensed for use to S&P Opco, LLC and CNN. Standard & Poor's and S&P are registered trademarks of Standard & Poor's Financial Services LLC and Dow Jones is a registered trademark of Dow Jones Trademark Holdings LLC. All content of the Dow Jones branded indices © S&P Dow Jones Indices LLC 2018 and/or its affiliates.

Most stock quote data provided by BATS. Market indices are shown in real time, except for the DJIA, which is delayed by two minutes. All times are ET. Disclaimer. Morningstar: © 2018 Morningstar, Inc. All Rights Reserved. Factset: FactSet Research Systems Inc. 2018. All rights reserved. Chicago Mercantile Association: Certain market data is the property of Chicago Mercantile Exchange Inc. and its licensors. All rights reserved. Dow Jones: The Dow Jones branded indices are proprietary to and are calculated, distributed and marketed by DJI Opco, a subsidiary of S&P Dow Jones Indices LLC and have been licensed for use to S&P Opco, LLC and CNN. Standard & Poor's and S&P are registered trademarks of Standard & Poor's Financial Services LLC and Dow Jones is a registered trademark of Dow Jones Trademark Holdings LLC. All content of the Dow Jones branded indices © S&P Dow Jones Indices LLC 2018 and/or its affiliates.