NEW YORK (CNNfn) - Oakmark Fund lost 10.50 percent in 1999, one of the best years of the best bull markets in history. It is down 20 percent in the first two months of 2000. Shareholders have yanked out more than $7 billion in assets.
A perfect time for investors to get in the door, says new fund manager Bill Nygren.
"The portfolio I inherited last week is a great portfolio," Nygren said. "The values relative to the market are really incredible."
Also in this column: A new manager at Vanguard; and some new performance figures from fund-tracker Morningstar.
Harris Associates, the fund's adviser, replaced longtime Oakmark Fund manager Robert Sanborn with Nygren last week because of poor performance and massive redemptions.
Nygren is manager of Oakmark Select Fund, which has beaten 97 percent of its peers in the last three years, Morningstar said.
"I don't think it has anything personally to do with Bob," Nygren said of the manager change. Part of the problem is Sanborn fell short of his peers because other value managers drifted into growth stocks.
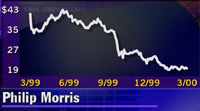
Some of Sanborn's stock picks have also struggled, like beaten-down tobacco stock Philip Morris (MO: Research, Estimates); toy company Mattel (MAT: Research, Estimates), where a string of executives have stepped down amid financial setbacks; and Lockheed Martin (LMT: Research, Estimates).
 Oakmark Fund was in the 86th percentile of its category in 1996; rebounded someone to the 12th percentile the following year; and has been in the 93rd percentile or worse since then. Oakmark Fund was in the 86th percentile of its category in 1996; rebounded someone to the 12th percentile the following year; and has been in the 93rd percentile or worse since then.
Sanborn was forced to sell many securities to meet redemptions, so by December 1999 the fund was down to 23 names, Nygren said.
Nygren has trimmed the position in Philip Morris and plans to increase the number of holdings to 40 to 50 names. Other than that, he doesn't see big changes.
"You can see I use the same portfolio approach that led to the creation of Oakmark Fund," Nygren said. "There's not a significant change in management style."
Nygren has so much confidence in the portfolio that he's made a "significant personal investment" in the fund. He isn't saying how much.
Tax-conscious investors may also want to consider the fund because it will probably be several years before it makes a capital gains distribution, Nygren said.
"It's one of the few funds that is in such a favorable tax situation," Nygren said. "The fund has a large realized loss and an unrealized loss."
As far as Sanborn goes, the change was obviously painful. Sanborn was also replaced recently as one of the fleet of expert managers at Master's Select Equity Fund. That fund's adviser replaced Sanborn with Bill Miller of Legg Mason Value Trust, a value manager whose returns have soared with stocks like Amazon.com.
Sanborn said any value managers who did well in the 1990s loaded their portfolios with growth stocks. He said he's proud of his record, where he earned 48.90 percent in 1992, and 30.5 percent in 1993.
"From the day I started until now, I'm very proud of that record," Sanborn said. "Very few value funds did as well in that period."
Sanborn will remain with Harris Associates and will continue to manage several large private accounts, the company said.
Sanborn, the largest shareholder in Oakmark Fund, said this is the best time in his career to be a value investor.
"That's what makes this a little tough," Sanborn said. "It is bittersweet for me."
Vanguard Group this week announced it named Grantham, Mayo, Van Otterloo & Co. to the team of managers at Vanguard Explorer Fund effective April 3.� Vanguard Explorer Fund, with $4.4 billion in assets, invests in small-cap growth stocks and has four other advisers managing the portfolio.
Vanguard, like many fund companies these days, uses a team of managers with Vanguard Windsor Fund, Windsor II Fund; Vanguard Morgan Growth and Vanguard Equity Income Fund.
Battered financial stock funds were big winners for the week ending March 24, with average returns of 4.80 percent, according to Morningstar. Other winners include large growth, up 4.23 percent; Pacific/Asia funds that exclude Japan, up 3.86 percent, large blend funds, ahead 3.77 percent; and Latin America stock funds, up 3.50 percent.
Among the biggest losers were Japan funds, down 3.40 percent; health funds, down 2.50 percent; high-yield bond funds, down 0.51 percent; intermediate-term bond funds, off 0.20 percent; and multisector bond funds, down 0.19 percent.
Year to date, the best-performing U.S. diversified stock funds include Frontier Equity Fund, up 113.25 percent; PBHG New Opportunities Fund, up 65.01 percent; PBHG Select Equity Fund, up 57.39 percent; Kopp Emerging Growth Fund, up 57.31 percent; and Berkshire Focus Fund, up 56 percent.
At the other end of the list, worst year-to-date performers include ProFunds UltraShort OTC Inv Fund, off 46.38 percent; Potomac OTC/Short Fund, down 24.10 percent; Rydex Consumer Products Inv Fund, down 20.35 percent; FPA Paramount Fund, down 19.70 percent; and Rydex Basic Materials Inv� Fund, down 18.07 percent.
Click here to see new Morningstar data featured on CNNfn.com's retirement-planning section. 
|