|
Economic growth slowing?
|
 |
April 4, 2000: 10:24 a.m. ET
Conference Board's key forecasting measure falls 0.3% in February
|
NEW YORK (CNNfn) - A key forecaster of the U.S. economy fell for the first time in four months in February, hindered by rising short-term interest rates, fewer new building permits and a drop in orders for manufactured goods, a private industry report released Tuesday showed.
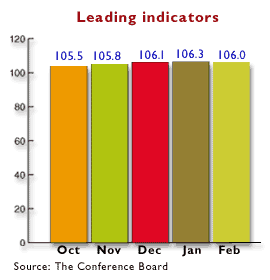
The Conference Board's index of leading economic indicators slipped 0.3 percent to 106.0 in February from a gain of 0.2 percent in January, a slightly bigger decline than the 0.1 percent drop expected by analysts polled by Briefing.com. The index, which aims to forecast the economy's progress six to nine months ahead, stood at 100 in 1992.
 Eight of the index's 10 indicators declined. The most significant decreases were the number of new building permits, new orders for manufactured goods, and a narrower difference, or spread, between present and longer-term rates. The two areas that did show gains were factory orders and the average hourly workweek. Eight of the index's 10 indicators declined. The most significant decreases were the number of new building permits, new orders for manufactured goods, and a narrower difference, or spread, between present and longer-term rates. The two areas that did show gains were factory orders and the average hourly workweek.
"Signals for the immediate future point to continued expansion, although not at the breakneck pace of the fourth quarter of 1999," Conference Board Economist Ken Goldstein said. "The biggest risk to the ongoing expansion continues to be interest-rate increases and the prospect of still more Federal Reserve Board action."
Since last June, the FOMC has raised its benchmark fed funds rate in quarter-point increments to 6 percent. The committee next meets May 16. Analysts expect the Fed to raise its target to 6.25 percent by the end of the second quarter and to 6.5 percent in the fourth quarter, according to the implied yield on fed funds futures contracts.
Goldstein suggested that the Fed's series of rate increases are beginning to have an impact on certain sectors, "but certainly not enough to prevent the economy from reaching new records for longevity." The U.S. economy entered its 107th month of uninterrupted expansion in February, the longest period of growth since the 1960s.
The board's index of coincident indicators, a gauge of current economic activity including industrial output, increased 0.1 percent in February after rising 0.4 percent in January. Its index of lagging indicators rose 0.8 percent after falling 0.1 percent in January. 
|
|
|
|
|
|
U.S. Conference Board
|
Note: Pages will open in a new browser window
External sites are not endorsed by CNNmoney
|
|
|
|
 |

|