|
E*Trade stuns with profit
|
 |
April 12, 2000: 1:53 p.m. ET
Online brokerage surprises analysts, who expected loss in fiscal 2Q
|
NEW YORK (CNNfn) - Online brokerage E*Trade Group Inc. reported a profit Wednesday for its fiscal second quarter -- surprising analysts who expected a loss for the quarter -- citing a surge in trading volume and almost a doubling of new customers compared with a year earlier.
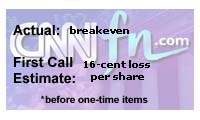
E*Trade, the No. 2 online brokerage behind Charles Schwab Corp., posted operating earnings of $1.3 million, or breakeven on a per share basis, for the second quarter ended March 31. Revenue more than doubled to $407 million from $162 million in the year-earlier quarter.
The earnings compare with an operating loss of $13.3 million, or 5 cents a share, in the year-earlier quarter, and the 16-cent-a-share loss expected by analysts polled by First Call Corp.
 The stellar results reflect the surging popularity of online investing and trading, and E*Trade's success at making itself a household name, according to analysts. They also attest to the company's success at diversifying itself to offer all types of financial products and services, not just stock trades, according to Pacific Crest Securities e-banking analyst Tim Butler. The stellar results reflect the surging popularity of online investing and trading, and E*Trade's success at making itself a household name, according to analysts. They also attest to the company's success at diversifying itself to offer all types of financial products and services, not just stock trades, according to Pacific Crest Securities e-banking analyst Tim Butler.
"They had an excellent quarter overall; they continued to show strength and leveragability of their brand," Butler said. "There's no doubt the industry is competitive and E*Trade has emerged in a leadership role."
Butler currently rates E*Trade stock a "strong buy" and anticipates raising his per-share targets on the company's stock for its fiscal third and fourth quarters.
Stock inches up
After surging more than 1-1/2 points at the open, E*Trade (EGRP: Research, Estimates) shares pared its gain to just 1/2, to 23-15/16, in midday trading. Butler predicts the stock has "near-term upside into the mid- to high-40s."
Including one-time charges for merger-related activity and amortization of goodwill -- an accounting practice many tech companies incorporate into their earnings to recognize long-term costs and benefits -- E*Trade posted a net loss of $23.2 million, or 8 cents a share. That compares with earnings of $8.6 million, or 3 cents, in the second quarter of 1999.
 The company signed on some 600,000 new accounts in the latest quarter, more than double what it had a year earlier, bringing the total number of active accounts to 2.6 million. That brings it closer to industry leader Charles Schwab (SCH: Research, Estimates), which had more than 3.3 million accounts at the end of March. The company signed on some 600,000 new accounts in the latest quarter, more than double what it had a year earlier, bringing the total number of active accounts to 2.6 million. That brings it closer to industry leader Charles Schwab (SCH: Research, Estimates), which had more than 3.3 million accounts at the end of March.
At the same time, E*Trade continued to focus its sights on the brick-and-mortar world, which should help lift its bottom line in subsequent quarters, Butler said. Last month, E*Trade agreed to acquire Card Capture Services Inc., the largest independent network of automated teller machines in the United States, giving it access to 8,500 ATM machines worldwide.
Collectively, the Menlo Park, Calif.-based firm held some $65 billion in assets and deposits for its customers, about double what it held in the year-earlier period. Total page views were 1.3 billion compared with 472 million in the second quarter of 1999. The cost of opening a new account declined to $294 compared with $355 in the fiscal first quarter.
The company said it processed a record 229,000 trades a day in the January-March quarter. That was up from 70,000 daily a year earlier and 133,000 daily in the first quarter, its previous record. On advertising and marketing, E*Trade said it spent $177.5 million in the quarter, more than double the $78.2 million of a year earlier.
Click here for a summary of Wednesday's earnings announcements. 
|
|
|
|
|
|
E*Trade
|
Note: Pages will open in a new browser window
External sites are not endorsed by CNNmoney
|
|
|
|
 |

|