|
Continental, NW top target
|
 |
April 20, 2000: 7:46 p.m. ET
Fuel hikes hit both, as Continental profit falls while Northwest cuts losses
|
NEW YORK (CNNfn) - Continental Airlines Inc. and Northwest Airlines flew well above analysts' expectations Thursday for the first quarter, although results for both were hurt by a steep climb in fuel prices.
Houston-based Continental overcame fuel price increases of 120 percent in the quarter to post net income of $14 million, or 21 cents a diluted share. Analysts surveyed by earnings tracker First Call had predicted breakeven results in the period.
A year earlier, the nation's fifth-largest airline earned $73 million, or 97 cents a diluted share, excluding a charge for an accounting change and a gain on the sale of its share of Equant, an industry-wide communications network.
Continental (CAL: Research, Estimates) said revenue rose 11.5 percent to $2.3 billion from $2.0 billion a year earlier.
Continental Chairman and CEO Gordon Bethune told CNNfn the company overcame rising fuel costs by doing a "wonderful job" on the expense ledger.
"We really worked our revenue and March came on so strong we overcame a pretty poor start," Bethune said.
He added that the company will not be part of the new trend of removing seats to add leg room. (324K WAV or 324K AIFF)
 The airline said fuel costs rose by $187 million in the quarter. It saved $10 million by paying lower commissions to travel agents, as it followed other carriers in cutting commissions and moving more ticket sales to the Internet. The airline said fuel costs rose by $187 million in the quarter. It saved $10 million by paying lower commissions to travel agents, as it followed other carriers in cutting commissions and moving more ticket sales to the Internet.
Continental also helped support earnings per share with a stock buyback program that reduced shares outstanding by 17 percent. The company said it will increase the buyback program by spending half of future net income plus all net proceeds from the sale of non-strategic assets to repurchase common stock.
Fuel hikes push Northwest into red
Northwest Airlines (NWAC: Research, Estimates), the nation's fourth-largest carrier, narrowed its loss from operations; analysts had expected it to widen.
The company lost about $41 million, or 51 cents a share in the quarter, excluding special gains from its investment in Priceline.com Inc. (PCLN: Research, Estimates). That is less than the year-earlier loss of $47 million, or 58 cents a share. First Call analysts forecast that Northwest's loss would climb to 71 cents a share.
 The company said an 80 percent increase in fuel costs was responsible for the operating loss. Without the cost increase, the company said, it would have earned 69 cents a share in the period on an operating basis. The company said an 80 percent increase in fuel costs was responsible for the operating loss. Without the cost increase, the company said, it would have earned 69 cents a share in the period on an operating basis.
Northwest's gain from Priceline.com and from the sale of its stake in Equant a year earlier brought net income in the quarter to $3 million, or 3 cents a share, compared with a net loss of $29 million, or 36 cents a share, a year earlier.
Revenue rose 13 percent to $2.6 billion from $2.3 billion. Revenue yield per passenger mile, a measure of fares, rose 4 percent to 11.85 cents, and the load factor improved to 72.5 percent from 70.9 percent.
Many of the larger carriers, including UAL Corp. (UAL: Research, Estimates), parent of United Airlines, AMR Corp (AMR: Research, Estimates), parent of American Airlines, and Delta Air Lines (DAL: Research, Estimates) also reported better-than-expected results for the first quarter.
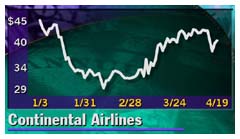
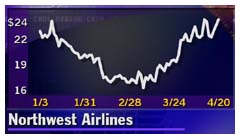
Shares of Continental fell 7/8 to 39-1/2 in trading Thursday after initially being up after the report. Northwest shares slipped 1/16 to 23-9/16, also off an earlier gain. 
|
|
|
|
|
 |

|

