|
Oil earnings beat forecasts
|
 |
April 25, 2000: 9:33 a.m. ET
Higher oil prices help Exxon Mobil, Texaco and Conoco beat estimates
|
NEW YORK (CNNfn) - Higher oil prices led to sharply higher earnings for some of the nation's leading oil companies reporting first-quarter results Tuesday.
Exxon Mobil Corp., the world's biggest oil company, earned $3.4 billion, or 95 cents a share, excluding special charges from its recent merger. Analysts surveyed by First Call were forecasting earnings of 90 cents a share for the Dow component.
 The company earned $1.6 billion, or 46 cents a share, in the same period last year on a pro forma basis, excluding merger costs. The company earned $1.6 billion, or 46 cents a share, in the same period last year on a pro forma basis, excluding merger costs.
Including special items, pro forma net income rose to $3.5 billion, or 99 cents a share, from $1.5 billion, or 42 cents a share, a year earlier. Special items in the most recent quarter included gains from selling assets required by regulators to approve the merger.
Revenue rose to $55.1 billion from combined $38.7 billion a year earlier.
The more than doubling of crude oil prices lifted Exxon Mobil's exploration and production profits, excluding merger impact, to $2.8 billion from $792 million last year. But profits from refining and marketing fell by nearly a third to $369 million from $567 million on a pro forma basis a year earlier. Chemical earnings edged up to $320 million from $311 million.
The company said its merger-related job reductions are on schedule, and that charges in the quarter included separation for 2,200 employees in the quarter, with half of those in the United States.
Shares of Exxon Mobil �(XOM: Research, Estimates) rose 7/8 to 79-7/8 in trading Monday.
Texaco also beats forecasts
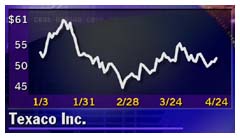
Texaco Inc. earned $602 million, or $1.10 a diluted share, in the quarter. Analysts surveyed by earnings tracker First Call forecast 98 cents a share for the White Plains, N.Y.-based company. Texaco earned $105 million, or 15 cents a share, before special items in the year-earlier period.
 Including special items, net income came to $574 million, or $1.05 a share, compared with $199 million, or 35 cents a share, a year earlier. The recent special items included a $67 million loss on an asset sale, litigation expenses of $13 million and employee separation costs of $12 million. Those were partly balanced by a $46 million tax gain and an $18 million gain from adjusting employee benefits. Including special items, net income came to $574 million, or $1.05 a share, compared with $199 million, or 35 cents a share, a year earlier. The recent special items included a $67 million loss on an asset sale, litigation expenses of $13 million and employee separation costs of $12 million. Those were partly balanced by a $46 million tax gain and an $18 million gain from adjusting employee benefits.
Revenue rose $11.3 billion from $7.2 billion a year earlier.
Shares of Texaco (TX: Research, Estimates) rose 7/8 to 51-11/16 in trading Monday.
Conoco posts record profit
Conoco Inc. posted record first-quarter earnings of $391 million, or 62 cents a diluted share, before special items. The analyst forecast from First Call was 60 cents a share.
A year earlier, Conoco earned $83 million, or 13 cents a share.
Net income including all special items came to $399 million, or 63 cents a diluted share, in the latest period.
Revenue rose to $8.7 billion from $5.3 billion a year earlier.
Shares of Conoco (COC.A: Research, Estimates) slipped 1/16 to 23-1/16 in trading Monday. 
|
|
|
|
|
 |

|