graphic
News > Companies
Best Buy to best estimates
June 1, 2000: 10:13 a.m. ET

Electronics retailer said record sales should let it top 1Q forecasts
graphic
graphic graphic
graphic
NEW YORK (CNNfn) - Electronics retailer Best Buy announced Thursday that its fiscal first-quarter earnings should top forecasts by more than 20 percent, citing record sales during the period.

The Minneapolis-based chain graphicsaid earnings should climb more than 50 percent to about 34 cents a diluted share. Analysts surveyed by earnings tracker First Call predicted the company to earn 28 cents a share for the three months ended May 27.
In the year-earlier quarter, the company earned $47.3 million, or 22 cents a share, when it also reported record results and beat earlier estimates.

Sales in the fiscal first quarter increased 24 percent to $2.96 billion. Sales at stores open at least a year -- a closely watched measure of retail strength known as same-store sales -- gained 9.5 percent in the quarter, although that was off from the 13.5 percent same-store sales gain reported in the year-earlier period. Digital products, personal computers music and movies sales led the gain in the most recent period.

Best Buy also said it is ready to launch an e-commerce site in the next few weeks. While its move into e-commerce has been expected, this is the best indication yet of the timing of the launch.

The full financial results are due to be reported June 13.

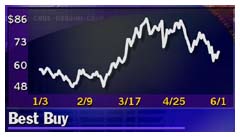
Shares of Best Buy  (BBY: Research, Estimates) gained 3-5/16 to 67-5/16 in trading early Thursday. Back to top

  RELATED STORIES

Retail sales weak in May - June 1, 2000

Hitting the right formula - May 23, 2000

Retail stocks take a hit - May 3, 2000

  RELATED SITES

Best Buy investor relations


Note: Pages will open in a new browser window
External sites are not endorsed by CNNmoney


graphic


Most stock quote data provided by BATS. Market indices are shown in real time, except for the DJIA, which is delayed by two minutes. All times are ET. Disclaimer. Morningstar: © 2018 Morningstar, Inc. All Rights Reserved. Factset: FactSet Research Systems Inc. 2018. All rights reserved. Chicago Mercantile Association: Certain market data is the property of Chicago Mercantile Exchange Inc. and its licensors. All rights reserved. Dow Jones: The Dow Jones branded indices are proprietary to and are calculated, distributed and marketed by DJI Opco, a subsidiary of S&P Dow Jones Indices LLC and have been licensed for use to S&P Opco, LLC and CNN. Standard & Poor's and S&P are registered trademarks of Standard & Poor's Financial Services LLC and Dow Jones is a registered trademark of Dow Jones Trademark Holdings LLC. All content of the Dow Jones branded indices © S&P Dow Jones Indices LLC 2018 and/or its affiliates.

Most stock quote data provided by BATS. Market indices are shown in real time, except for the DJIA, which is delayed by two minutes. All times are ET. Disclaimer. Morningstar: © 2018 Morningstar, Inc. All Rights Reserved. Factset: FactSet Research Systems Inc. 2018. All rights reserved. Chicago Mercantile Association: Certain market data is the property of Chicago Mercantile Exchange Inc. and its licensors. All rights reserved. Dow Jones: The Dow Jones branded indices are proprietary to and are calculated, distributed and marketed by DJI Opco, a subsidiary of S&P Dow Jones Indices LLC and have been licensed for use to S&P Opco, LLC and CNN. Standard & Poor's and S&P are registered trademarks of Standard & Poor's Financial Services LLC and Dow Jones is a registered trademark of Dow Jones Trademark Holdings LLC. All content of the Dow Jones branded indices © S&P Dow Jones Indices LLC 2018 and/or its affiliates.