|
Chip sales soar in April
|
 |
June 2, 2000: 3:42 p.m. ET
PC, wireless-phone demand drives surge; Asia posts sharpest gain
|
NEW YORK (CNNfn) - Worldwide semiconductor sales continued to soar in April amid strong demand for personal computers, cellular phones and wireless communications, a chip-industry trade group said Friday.
According to the Semiconductor Industry Association, chip sales grew 35.6 percent to $15.2 billion from $11.2 billion a year ago. That's a record for the month of April, and is stronger than had been expected.
"April sales show continued industry growth and are surpassing our expectations for 2000," said SIA President George Scalise.
 The spring and summer months historically have been the slowest for the chip industry, with the bulk of sales taking place during the holiday and back-to-school seasons, when demand for PCs is higher. The spring and summer months historically have been the slowest for the chip industry, with the bulk of sales taking place during the holiday and back-to-school seasons, when demand for PCs is higher.
However, the soaring demand for wireless phones has helped to offset some of the seasonal sluggishness, Scalise said.
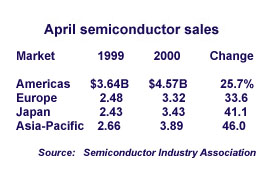
The most marked increase was in the Asia-Pacific region, where sales rose 46 percent from the same period last year. Sales in Japan were up 41.1 percent. European sales rose 33.6 percent. Sales in the Americas were up 25.7 percent from last year, the SIA said.
Sales of flash memory chips - which hold their data even when the devices they are used in are powered down, making them ideal for use in wireless phones and other portable devices - and digital signal processors - which convert analog signals such as sound into a digital format - continued to show exceptional growth. In the first four months of 2000, flash memory sales grew 193 percent, the SIA said.
The most recent report is the fifth in a row showing that chip sales have reached a monthly record.
Chip stocks, which already had been boosted by a recent batch of investor-friendly economic data, soared in Friday's market. The Philadelphia Stock Exchange's semiconductor index was up 85.19, or nearly 8 percent, at 1,152.47. 
|
|
|
|
|
 |

|