|
Lazy days of summer
|
 |
June 22, 2000: 6:14 a.m. ET
Trading volume tails off after a record 1Q; stocks adrift as quiet period arrives
By Staff Writer Alex Frew McMillan
|
NEW YORK (CNNfn) - Summertime, and stocks are drifting like a yacht tacking off the Hamptons. Investors may be waiting for that crack of rope against steel winch when the wind bursts against the canvas, billowing their sails. But they'll have to be calm instead, precedent and the pundits suggest.
The heat has come, but the market has cooled off. It is adrift. Up a few points one day, down the next, riding little waves with no strong direction. Since tech stocks sank in March and April, many investors winced away. While Nasdaq is now near breakeven year to date, the strays have yet to return.
In fact, last week was the worst this year for Internet-stock trading volume. It was also the slowest since October, excluding the 1999 Christmas holiday week, according to a report from CS First Boston online brokerage analyst Jim Marks.
After a promising start to June, volumes tumbled again. The longest days are here. But for volumes, it is a case of "I've fallen and I can't get up," according to Marks, who uses Internet stocks as a proxy for weekly online-trading volume.
Trading down more than a quarter in the quarter
"There's a certain amount of people that probably got cleaned out and aren't coming back," Marks said. "There's nothing to entice them to come back, until the market does perform well." When the market starts performing well, people are more likely to trade. Some start to experiment, or feel overconfident. Some worry they are missing the boat.
There is also a sudden increase in trading when the market plummets, according to Marks. That came near the end of April, as the tech freefall reached terminal velocity. But that has long passed.
Last week, an average of 238 million shares in Internet stocks traded per day, according to Marks. That was down 27 percent from the previous quarter. It was even down 9 percent from May, when trading levels were not strong.
He's predicting declining activity for online brokers as a result, down 15 percent to 30 percent from the previous quarter. The record trading levels from the start of this year weren't sustainable anyway, Marks says.
He does not think volume will rebound until the market shows clear signs of a strong rally. Some investors are licking their wounds from April. The traditional summer drop-off in volume is adding salt.
A quiet time of poor performance
What do the summer doldrums mean? Summer often sees a dip in stock performance, which would prompt a drop in volume. It can be chicken-and-egg, too -- stocks are unlikely to move in any certain direction if there's little demand. On the positive side, there's little selling pressure.
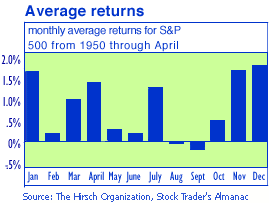
 The worst performing months are September and August, both of which average a net loss in the S&P, according to Yale Hirsch, who edits the Stock Trader's Almanac. The worst performing months are September and August, both of which average a net loss in the S&P, according to Yale Hirsch, who edits the Stock Trader's Almanac.
June, February and May are next worst, with slight gains in the S&P. June and February average a 0.2 percent gain, while the index rises about 0.3 percent in May.
July is the only bright spot in the summer months, as far as performance goes, with a 1.3 percent average increase in the S&P, according to Hirsch's data. The best-performing months for the market, by far, are December, November and January, according to his figures. December has an average gain of 1.8 percent. The other two months have an average gain of 1.7 percent.
Summer mixed for volume change
As far as trading volume goes, the summer doldrums do happen, but not every year. It is hard to make any firm conclusions looking at trading volumes year over year because volumes tend to rise, and have risen particularly fast recently.
At least anecdotally, the assumption is that much of the trading world takes off on vacation come June, July and August. "New York heads to the Hamptons in the summer" is a common knock on Wall Street.
 Of course, that's unlikely to be the case if there is serious money to be made or lost. But summer certainly tends to be a time of no great conviction, at least as far as surges in volume go. And surges suggest rallies, or at least action. Some pundits like to suggest there is a propensity toward summer rallies, too. Of course, that's unlikely to be the case if there is serious money to be made or lost. But summer certainly tends to be a time of no great conviction, at least as far as surges in volume go. And surges suggest rallies, or at least action. Some pundits like to suggest there is a propensity toward summer rallies, too.
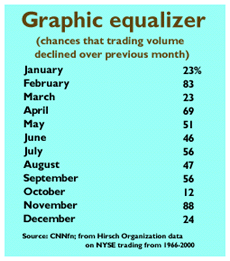
Instead, the summer is a mixed bag for volume. The months from May to September are almost equally likely to see a rise or a drop in volume from the prior month.
That is a stark contrast from January and December -- two of the three best months for market performance -- when volume is almost sure to pick up.
Hirsch Organization data on New York Stock Exchange trading between 1966 and 2000, as crunched by CNNfn.com, show that fewer than one in four Decembers and Januarys saw a drop-off in trading over the prior month.
What does this year bring?
So far, this is one of the off vacation seasons for volume. May 26 -- the Friday before Memorial Day -- marked the lowest volume day of the year on Nasdaq, with 1.07 billion shares traded. By way of contrast, more than two-and-a-half times that amount traded on Nasdaq on the busiest day of the year, April 4, when 2.88 billion shares changed hands.
Eight of the 10 slowest days for Nasdaq came in May. The two others came in June. The stats suggest July will bring a slight pickup in volume, perhaps because July tends to bring the most positive summer performance.
But don't expect much from August and September, the stat sheet suggests.
Fundamentals are factors
Hugh Johnson, chief investment officer at First Albany, does not believe that there is such a thing as summer doldrums. The drop in volume and the meandering markets are specific to the current economic climate, he believes.
"The slowdown that we've seen and the trendlessness that we've seen in the market are driven by fundamentals," he said. Both the stock and bond markets are presenting a holding pattern, with a slowing economy.
Why the waves? Sometimes news comes out that suggests the economy has cooled but still growing, and the Fed will not raise rates, and all is good. The bulls buy. Sometimes news comes out that suggests earnings will not be good, or inflation is growing. The bears sell.
Summer isn't always slow and meandering. When the Gulf War was in full swing, it marked a summer trading bonanza for the stock market. Likewise when the Asian crisis broke, those were the busiest months of the trading year.
But in both cases, the news was negative. The market sank like an anchor into a murky bay. When the sand settled, investors were left wishing it had been smooth sailing instead.
In fact, perhaps the most exciting time in the stock market's history came in summer, Johnson points out. He has read up on it.
Which summer? "The most exciting period in U.S. stock market history was the summer of 1929," Johnson said. "It was the summer, and nobody went on vacation. Many books have been written about how exciting it was."
And then came the fall, and Wall Street's darkest days. Maybe a slow summer isn't such a bad sign after all.
Disclaimer 
-- Click here to send email to Alex Frew McMillan
|
|
|
|
|
|
Track your stocks
|
Note: Pages will open in a new browser window
External sites are not endorsed by CNNmoney
|
|
|
|
 |

|

