|
Chip sales on the rise
|
 |
June 30, 2000: 1:19 p.m. ET
Industry group reports 39.8 percent increase in May fueled by PCs, wireless
|
NEW YORK (CNNfn) - Semiconductor sales soared to record levels in May fueled by continued demand for personal computers and communications devices, a chip-industry trade group said Friday.
According to the Semiconductor Industry Association, worldwide chip sales totaled $15.8 billion. That's up 39.8 percent from May 1999 and the highest-ever one-month sales total on record, the association said.
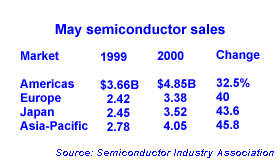
The most marked increases were in the Asia-Pacific region, where sales rose 45.8 percent, and in Japan, where sales increased 43.6 percent. Sales in Europe were up 40 percent, while sales in the Americas rose 32.5 percent, the SIA said.
 In addition to the microprocessors and dynamic random access memory (DRAM) chips that are used in PCs, sales of analog chips, digital signal processors (DSPs), and flash memory chips played a major role in the sales increases, according to the SIA. Those products are used extensively in communications products such as wireless telephones and portable e-mail and Internet access devices. In addition to the microprocessors and dynamic random access memory (DRAM) chips that are used in PCs, sales of analog chips, digital signal processors (DSPs), and flash memory chips played a major role in the sales increases, according to the SIA. Those products are used extensively in communications products such as wireless telephones and portable e-mail and Internet access devices.
"May's strong global sales are in line with our recently-released mid-year forecast that predicts a 31 percent growth rate for 2000," said George Scalise, the SIA's president.
Earlier this month, the trade group, whose member companies comprise more than 90 percent of U.S.-based semiconductor production, revised its growth forecast for the chip industry. After rising 31 percent to $195 billion in 2000, the SIA said it expects chip sales to expand 25 percent to $244 billion in 2001 and 14 percent to $279 billion in 2002.
Chip stocks got a boost from the news. The Philadelphia Stock Exchange's semiconductor index rose 27.04 to 1,155.23, a 2.4 percent advance on the day. 
|
|
|
|
|
 |

|

