|
UAL warning sinks airlines
|
 |
July 19, 2000: 9:31 a.m. ET
United, American, and TWA beat 2Q forecasts, but warning scares investors
|
NEW YORK (CNNfn) - The owners of the nation's two largest airlines flew well above the expected gains in second-quarter earnings, but an earnings warning from industry leader UAL Corp. helped sink stocks across the sector in trading Wednesday.
Strong demand for seats and rising fares helped UAL, owner of global leader United Airlines, and AMR Corp., owner of the No. 2 U.S. airline American Airlines, conquer higher fuel prices, which rose more than one-third from a year ago.
One of the nation's most fiscally troubled carriers, Trans World Airlines (TWA: Research, Estimates), also managed to post a loss that was narrower than both estimates and year-ago results.
But UAL takeover target US Airways Group Inc. (U: Research, Estimates) posted earnings that fell well below analyst expectations as well as year- earlier results, which helped contribute to the sector's sell-off.
United faces schedule, crew issues
UAL lowered its estimates for the third quarter and the year, citing rising labor costs and the cuts in its schedule to deal with crew staffing issues. The employee-owned airline faces hostile relations with its pilots, who own a 25 percent stake in the company, due the current contract negotiations and their concerns over the planned purchase of US Airways.
 Those problems caused the company to say it will earn $2.60 to $3.20 a share in the third quarter, and between $8.25 and $9.75 a share for the full year, excluding special items. The previous First Call forecast had been for earnings of $3.55 for the third quarter and $9.95 a share for the year. Those problems caused the company to say it will earn $2.60 to $3.20 a share in the third quarter, and between $8.25 and $9.75 a share for the full year, excluding special items. The previous First Call forecast had been for earnings of $3.55 for the third quarter and $9.95 a share for the year.
Analysts said the bad news was enough to hurt the sector Wednesday, even though other carriers are not hurt and actually may be helped by United's cutback in flights.
"I think there's an overreaction here," said Ray Neidl, analyst with ING Barings. "Everybody's getting crushed today, but I would interpret it as being a United problem."
Others said positive reports from Continental Airlines (CAL: Research, Estimates) and Southwest Airlines (LUV: Research, Estimates) Tuesday drove up the stocks in the sector and helped prompt the Wednesday selling.
"People are wondering if the United warning is a sign that the sector was over-priced," said Jim Higgins, analyst with Donaldson Lufkin and Jenrette. "You have a series of events letting the air out of things in the short term."
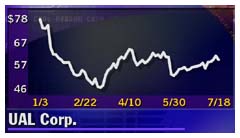
Shares of UAL (UAL: Research, Estimates) fell 6-1/8, or 10.3 percent, to 53-1/8 in trading Wednesday, while AMR (AMR: Research, Estimates) shares fell 2-3/4, or 8.4 percent, to 40-7/16.�
Meanwhile US Airways stock lost 1-9/16 to 40-7/16. Bucking the trend in the sector was TWA, which saw shares gain 3/16, or 8 percent, to 2-1/2.
Despite warning, United has good quarter
For the second quarter, UAL posted earnings of $408 million, or $3.47 a diluted share, excluding special charges. Analysts surveyed by earnings tracker First Call forecast that the company would earn $3.24 a share in the quarter.
It also was a 14 percent gain over earnings of $349 million, or $2.86 a diluted share, reported a year earlier, which also excluded special items.
Including special charges for early retirement of aircraft and replacement of video entertainment systems on some planes, net income came to $370 million, or $3.14 a share, compared with $761 million, or $6.27 a share, a year earlier. The year-ago figure includes gains from the sale of a stake in a computer reservation system.
The revenue of the world's largest airline grew to $5.1 billion in the latest period from $4.5 billion a year earlier. While fuel costs increased 40 percent to $589 million from $420 million, the airline benefited from higher demand and increased fares.
The passenger load factor, which compares miles traveled by paying passengers to available seats, increased to 75.6 percent from 70.1 percent, and average passengers revenue rose to 13.62 cents a mile from 12.69 cents. United and most other major carriers imposed fuel surcharges earlier this year.
For the first half, net income was $326 million, or $2.74 a share, compared with $949 million, or $7.81 a share, a year ago. Revenue rose to $9.7 billion from $8.7 billion.
American uses 'hedges' to control fuel costs
American posted earnings, excluding special items, of $285 million, or $1.75 a diluted share, better than the $1.57 a share First Call forecast and net income of $216 million, or $1.36 a share, it earned in the year-earlier period.
Including special charges, which included gain from the sale of holdings in Priceline.com (PCLN: Research, Estimates), net income came to $321 million, or $1.96 a share, for the quarter.
 The company said long-term fuel purchase contracts, known as hedges, saved it about $100 million in the quarter. But fuel costs still increased 37 percent to $567 million from $414 million a year earlier. The company said long-term fuel purchase contracts, known as hedges, saved it about $100 million in the quarter. But fuel costs still increased 37 percent to $567 million from $414 million a year earlier.
But as with United and most other major airlines that have reported for the quarter, strong traffic overcame those costs. Revenue rose 12 percent to $4.2 billion from $3.8 billion a year earlier. The passenger load factor improved to 75.9 percent from 71.5 percent a year earlier, and passengers paid an average of 13.75 cents a mile, up from 12.97 cents a year ago.
For the first half of the year, American posted income from continuing operations of $410 million, or $2.58 a diluted share, up from $233 million, or $1.45 a share, a year earlier, when the carrier was hit by a pilots work stoppage. Year-to-date revenue rose to $9.6 billion from $8.5 billion a year earlier.
US Airways misses target
US Airways posted net income of $80 million, or $1.17 a share, well below the forecast of $1.38 a share for the period, and down from the $1.83 it posted excluding special items a year earlier.
Revenue rose 6.4 percent to $2.4 billion from $2.3 billion for the nation's sixth largest carrier.
Analysts said due to the takeover offer from UAL, Wednesday's earnings report had little impact on stock price by itself.
For the first six months, US Airways posted a net loss of $138 million, or $2.07 a share, compared with net income of $363 million, or $4.67 a share, including special items in both periods. Year-to-date revenue gained 4 percent to $4.5 billion from $4.4 billion a year earlier.
TWA narrows loss
TWA posted a net loss of $4.2 million in the quarter, or 8 cents a share. But that was well below the 33 cents a share loss forecast by First Call, as well as below the $6.2 million loss, or 18 cents a share, it posted a year earlier. Revenue for the quarter rose to $954.9 million from $866.0 million a year earlier.
For the first six months the carrier's net loss came to $80.3 million, or $1.19 a share, compared with a net loss of $39.5 million, or 60 cents a share, a year earlier. Year-to-date revenue rose to $1.8 billion from $1.6 billion a year earlier. 
|
|
|
|
|
 |

|