graphic
Mutual Funds
Fund assets rise in June
July 31, 2000: 12:28 p.m. ET

Market performance, not cash flow, boosts overall picture, ICI reports
graphic
graphic graphic
graphic
NEW YORK (CNNfn) - Assets in mutual funds climbed 3.1 percent in June, due mostly to market performance rather than net new cash flow.

Combined net assets in all U.S. mutual funds rose to $7.120 trillion from $6.909 trillion in May, according to a monthly survey of the industry by the Investment Company Institute, a Washington-based trade group.
graphic"The cash flow picture, particularly to stock funds, seemed pretty much 'steady as she goes,'" said ICI spokesman John Collins.

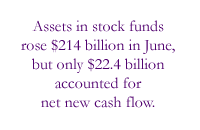
Stock funds received $22.37 billion in net new cash, up from $17.04 billion in May. But that's only a small part of the $214 billion increase in assets for the group, for a total of $4.321 trillion in June.

Assets of taxable and bond funds, meanwhile, increased by $14.59 billion for a total of $790.9 billion. Combined net new cash flow totaled $489.8 billion.

That represents a turn in the tide for taxable bond funds, which for the past year had regular outflows due to interest rate concerns, Collins said. Taxable bond funds received $1.64 billion in net new cash flow for the month, well above the $3.53 billion in outflows in May. Assets in June totaled $527 billion. Back to top

  RELATED STORIES

Mutual funds lose steam - June 29, 2000


graphic

Most stock quote data provided by BATS. Market indices are shown in real time, except for the DJIA, which is delayed by two minutes. All times are ET. Disclaimer. Morningstar: © 2018 Morningstar, Inc. All Rights Reserved. Factset: FactSet Research Systems Inc. 2018. All rights reserved. Chicago Mercantile Association: Certain market data is the property of Chicago Mercantile Exchange Inc. and its licensors. All rights reserved. Dow Jones: The Dow Jones branded indices are proprietary to and are calculated, distributed and marketed by DJI Opco, a subsidiary of S&P Dow Jones Indices LLC and have been licensed for use to S&P Opco, LLC and CNN. Standard & Poor's and S&P are registered trademarks of Standard & Poor's Financial Services LLC and Dow Jones is a registered trademark of Dow Jones Trademark Holdings LLC. All content of the Dow Jones branded indices © S&P Dow Jones Indices LLC 2018 and/or its affiliates.

Most stock quote data provided by BATS. Market indices are shown in real time, except for the DJIA, which is delayed by two minutes. All times are ET. Disclaimer. Morningstar: © 2018 Morningstar, Inc. All Rights Reserved. Factset: FactSet Research Systems Inc. 2018. All rights reserved. Chicago Mercantile Association: Certain market data is the property of Chicago Mercantile Exchange Inc. and its licensors. All rights reserved. Dow Jones: The Dow Jones branded indices are proprietary to and are calculated, distributed and marketed by DJI Opco, a subsidiary of S&P Dow Jones Indices LLC and have been licensed for use to S&P Opco, LLC and CNN. Standard & Poor's and S&P are registered trademarks of Standard & Poor's Financial Services LLC and Dow Jones is a registered trademark of Dow Jones Trademark Holdings LLC. All content of the Dow Jones branded indices © S&P Dow Jones Indices LLC 2018 and/or its affiliates.