|
Yahoo! beats estimates
|
 |
October 10, 2000: 7:50 p.m. ET
Web portal's revenue surges 90 percent; net income more than doubles
|
NEW YORK (CNNfn) - The Web portal Yahoo! Inc. reported third-quarter earnings Tuesday that beat analysts' expectations, signaling that the Internet advertising market remains strong -- at least for the industry's largest players.
For the quarter ended Sept. 30, the Santa Clara, Calif.-based company said its earnings, before one-time items, totaled $81.09 million, or 13 cents per diluted share, compared with $38.48 million, or 6 cents per share, in the year-ago quarter. Analysts surveyed by earnings tracker First Call had expected the company to earn 12 cents per share.
Yahoo! (YHOO: Research, Estimates) said its third-quarter revenue rose 90 percent to $295.55 million from $155.86 million in the same period last year. Traffic on the company's Web sites averaged 780 million page views per day in September, up from an average of 680 million in June. During September, Yahoo!'s global audience grew to more than 166 million unique users from 156 million last June and 120 million in December 1999.
 The Web portal's earnings report is regarded as a key indicator of the state of the Internet advertising market. In the second quarter, Yahoo! reported better-than-expected revenue of $270 million and pro forma net income of $74 million, or 12 cents per share. The Web portal's earnings report is regarded as a key indicator of the state of the Internet advertising market. In the second quarter, Yahoo! reported better-than-expected revenue of $270 million and pro forma net income of $74 million, or 12 cents per share.
"The global Yahoo! franchise is stronger today than ever before, and this is reflected in our performance this quarter -- our 16th consecutive quarter of profitability on a pro forma basis before acquisitions," said Tim Koogle, chairman and CEO, in a statement. "Once again, we exceeded expectations for financial performance by posting record revenues, operating profit and cash flow."
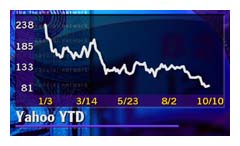
Yahoo! shares fell $3.06 to $82.69 in Nasdaq trade ahead of the earnings release. They tumbled another $6.44 to $76.25 in after-hours activity.
Click here to see how other stocks are trading after-hours
Merrill Lynch Internet analyst Henry Blodget had expected Yahoo! to report third-quarter revenue of $280.6 million, earnings per share of 12 cents, an operating margin of 37.5 percent, 741 million page views per day, and 165 million monthly unique visitors. The company met or exceeded all of those metrics, except for its operating margin, which rose to 36.1 percent in the third quarter from 32.5 percent in the same period last year.
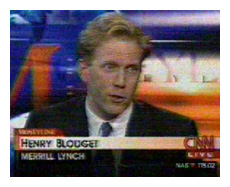 In an interview on CNNfn's Moneyline News Hour Tuesday, Blodget said he would recommend investors buy Yahoo! shares at their current level. He noted, however, that they would likely be in for some volatility in the short term. [116K WAV or 116K AIFF]. In an interview on CNNfn's Moneyline News Hour Tuesday, Blodget said he would recommend investors buy Yahoo! shares at their current level. He noted, however, that they would likely be in for some volatility in the short term. [116K WAV or 116K AIFF].
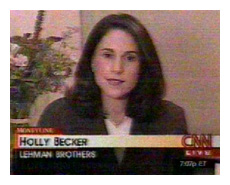
Holly Becker of Lehman Brothers had a different take.
She said her firms has been cautious on Yahoo! for a while and recommended investors stick to the sidelines until the company proves it can accelerate its growth rate. [95K WAV or 95K AIFF]
 In addition to serving as the world's busiest Web portal, Yahoo! is a major platform for e-mail messages and Web shopping. The company reported that its communication platform delivered 6.1 billion messages through its Mail, Messenger and eGroups services, up from 4.4 billion in June. In addition to serving as the world's busiest Web portal, Yahoo! is a major platform for e-mail messages and Web shopping. The company reported that its communication platform delivered 6.1 billion messages through its Mail, Messenger and eGroups services, up from 4.4 billion in June.
Voice minutes spent by individuals on Yahoo!'s communication services doubled to one billion total minutes during September, up from 500 million in June. Transactions enabled by Yahoo!'s shopping platform rose 300 percent compared with the third quarter of 1999. Merchants joining or renewing commerce agreements with Yahoo! in the third quarter included Barnes & Noble, Costco, Dell, FAO Schwarz, Hewlett-Packard, Kodak, Ritz Camera, Spiegel and Visa.
Provides comfort on state of Web advertising
Before the third-quarter earnings report, which was released after the closing bell, analysts had been concerned that financial distress among dot.coms would impair Yahoo!'s revenue and earnings.
Online advertising dollars have started to dry up as a slew of small, second-tier dot.coms have gone bankrupt. The surviving dot.coms are conserving their cash, since investors are reluctant to provide them with second or third rounds of funding. An analysis by Lehman Brothers and Booz Allen & Hamilton found that 75 percent of all online advertising revenue went to just nine sites, most notably America Online (AOL: Research, Estimates) and Yahoo!
In the past, Yahoo! hasn't disclosed what percentage of its advertising revenue comes from dot.coms. However, on a conference call after the third quarter earnings were released, the company said that 40 percent of its advertising revenue came from "pure-play" dot.com companies in the third quarter, down from 47 percent in the second quarter. Increased advertising from traditional brick and mortar companies replaced revenue lost from distressed Web firms, Yahoo! said.
The company said during its second quarter earnings report that less than 10 percent of its advertising revenue came from companies that were "financially questionable." That percentage was lower in the third quarter, the company said during a conference call.
While Yahoo's stock has declined 67 percent from its 52-week high, its valuation is still very high by traditional standards. At Tuesday's closing price of $82.69, the company's stock sells for about 184 times what analysts expect its earnings per share to be for all of this year.
Introduced voice services
Earlier Tuesday, Yahoo! Inc. announced that it is adding a new group of voice-based services in a bid to increase traffic over its network of sites and collect additional advertising revenue.�
Yahoo! by Phone (http://phoneyahoo.com) provides free access to personalized Web content over the telephone. Yahoo! Mail (http://mail.yahoo.com) provides free voicemail and allows users to listen to their e-mail over the phone. And a new version of Yahoo! Messenger allows people to place free phone calls to anyone, anywhere within the U.S. 
|
|
|
|
|
 |

|