|
Inktomi sees 1Q shortfall
|
 |
January 3, 2001: 4:42 p.m. ET
Internet software firm blames U.S. markets, economy for lowered outlook
|
NEW YORK (CNNfn) - Inktomi Corp., whose software helps manage the flow of data over the Internet, warned Wednesday that its fiscal first-quarter revenue and earnings will come in below its previous expectations.
The company said revenue for the quarter ended Dec. 31 is now expected to be between $80 million and $81 million, compared with its previous revenue forecast of between $89 million and $91 million.
Inktomi said it expects earnings for the quarter to be between breakeven and a penny per share, compared with its previous guidance of earnings between 2 cents and 3 cents per share.
 Executives at Inktomi in Foster City, Calif., blamed the shortfall on weakening conditions in the U.S. capital markets and the broader economy, which they said have caused a slowdown in spending on Internet infrastructure products. Executives at Inktomi in Foster City, Calif., blamed the shortfall on weakening conditions in the U.S. capital markets and the broader economy, which they said have caused a slowdown in spending on Internet infrastructure products.
"While our business will be affected by macro-economic conditions in the near term, we are confident in the long-term outlook for our infrastructure products and services," David Peterschmidt, the company's president and chief executive, said in a statement.
"We believe we have the management, products and financial focus to foster long-term benefits for our shareholders and customers worldwide," Peterschmidt added.
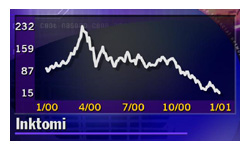
Inktomi (INKT: Research, Estimates) shares ended Wednesday's session $3.94, or 27 percent, higher at $18.50 amid a broader rally in the tech sector sparked by a surprise rate cut by the Federal Reserve. They rose another 12 cents to $18.62 in after-hours trade.
Still, the company's stock has fallen more than 92 percent from its 12-month high of $241.50. 
|
|
|
|
|
|
Inktomi
|
Note: Pages will open in a new browser window
External sites are not endorsed by CNNmoney
|
|
|
|
 |

|