|
TI logs 3Q loss, lowers bar for 4Q
|
 |
October 17, 2001: 5:10 p.m. ET
Chipmaker beats estimates but sees widening loss as weakness looms.
|
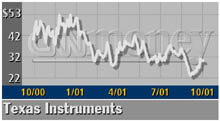
NEW YORK (CNNmoney) - Texas Instruments on Wednesday reported a third-quarter operating loss that was narrower than Wall Street had expected on sales that fell more than 43 percent from the same period last year.
Executives of TI also ratcheted down their financial targets for the current quarter, which they said could mark the bottom of a cyclical downturn in sales.
After the close of trading, TI (TXN: Research, Estimates) said it lost 3 cents per share during the third quarter, excluding one-time charges. That compares with an operating profit of 33 cents per share during the same quarter last year and is a penny narrower than the 4 cents per share analysts generally had expected the company to lose.
Including one-time charges, TI's net loss in the third quarter was $117 million, or 7 cents per share, compared with a net profit of $676 million or 39 cents per share a year ago.
At $1.8 billion, TI's third-quarter revenue fell more than 43 percent from the $3.2 billion it recorded during the year-ago quarter.
Despite the sharp year-over-year revenue decline, the company's third-quarter revenue reflected a 9 percent decline from the second quarter, where executives had forecast a sequential decline ranging between 10 and 15 percent.
The company said third-quarter orders declined 4 percent from the second quarter to $1.64 billion, an improvement over the 10 percent sequential decline in orders the company reported in the second quarter.
TI is the world's leading supplier of digital signal processors, or DSPs, and analog semiconductors, which together make up the electronic framework of a range of products such as digital mobile phones and high-speed Internet access devices. The company's chips are used in roughly two-thirds of the world's mobile phones.
The company said its overall book-to-bill for semiconductors continued to rise sequentially, and its DSP book-to-bill ratio exceeded one for the second consecutive quarter. A book-to-bill of more than one indicates that the company is taking more orders that it is shipping.
"DSP revenue was up 10 percent sequentially and orders were up 11 percent sequentially," Tom Engibous, TI's chairman and CEO, said in a statement.
"Orders for high-performance analog have turned the corner and increased 10 percent sequentially," Engibous added. "As things stand now, it appears that third quarter will mark the bottom for orders, and the floor for revenue should be set in the fourth quarter."
Looking ahead, TI said it expects fourth-quarter revenue is expected to decline about 10 percent sequentially, mostly due to normal seasonal declines in educational and productivity solutions and continued weakness in semiconductors.
The company said it expects to log a fourth-quarter operating loss of about 9 cents per share.
Analysts for the most part recently had expected the company's fourth-quarter revenue to be flat with the third quarter's and its operating loss to narrow to a penny per share. 
|
|
|
|
|
 |

|