NEW YORK (CNNmoney) - Europe's main stocks markets fell Thursday as Wall Street searched for direction, after news broke of another case of anthrax infection in New York, and while warnings from Germany's SAP and Anglo-Dutch CMG kept tech stocks under pressure.
Oil and bank stocks also lost ground.
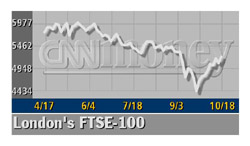
London's FTSE 100 lost 87.4 points, or 1.68 percent, to 5,116.0, trimming a loss of as much as 110 points. The CAC 40 ended down 1.66 percent at 4,338.09 points.
Frankfurt's electronically traded Xetra DAX was dragged lower by SAP's news. The benchmark index was down 1.55 percent at 4,572.62 points - off session lows - in late-day trading.
A CBS News employee became the fifth person to test positive for anthrax infection, as U.S. government officials announced a $1 million reward for information leading to the arrest and conviction of people involved in mailing the deadly bacteria.
Britain's leading shares closed lower, with oil stocks and banks in retreat.
SAP (FSAP), the world's biggest business software publisher, plunged 11 percent after cutting its full-year sales outlook and posting disappointing quarterly results, knocking down the benchmark DAX.
Anglo-Dutch IT services firm CMG (CMG) tumbled 21 percent after warning of a business downturn, triggering losses across technology sectors. Logica (LOG) and ARM Holdings (ARM) fell more than eight percent.
"Like other markets, the U.K. has made a remarkably good recovery from the depression three weeks ago and arguably they have got ahead of themselves," said Deutsche Bank equity strategist Bob Semple.
The oil sector took a hit after world crude prices dipped to a two-year low as dealers bet against any quick action for OPEC to halt a 25-percent price slide over the last month.
BP (BP) fell 4.1 percent to 569 pence and Shell (SHEL) shed 4.5 percent to 524 pence.
Banks were prominent in the market declines. HSBC (HSBA) lost 2.8 percent, and Lloyds TSB (LLOY) fell 2.4 percent, after Goldman Sachs cut their ratings to "market perform." �Standard Chartered (STAN) slid 8.6 percent.
Other techs fell in SAP's wake. Chipmaker Infineon (FIFX), which by Wednesday's close had gained 42 percent since September 28 on hopes the battered sector was finally emerging from its worst-ever slump, dropped 4.2 percent to 16.71 euros.
Electronics group Siemens (FSIE) fell 4.2 percent to 48.85 euros and Deutsche Telekom fell 2.8 percent to 17.97 euros.
Software maker Dassault Systemes, which reports third-quarter earnings on October 23, led the way with losses of 6.50 percent.
Chipmaker STMicroelectronics (PSTM) trimmed to 4.98 percent an earlier 9 percent loss after it reported an 11.8 percent slide in third-quarter sales.
In the U.S. stock markets, investors struggled to move forward early afternoon as mounting anthrax worries overwhelmed potentially positive corporate news, leaving indexes uneven.
At 1:30 p.m. ET, the Nasdaq composite index was down 4.70 to 1,461.64. The Dow Jones industrial average fell 80.12 to 9,152.36. 
-- from staff and wire reports
|