NEW YORK (CNNmoney) - Investors snapped up 30-year Treasury bonds Wednesday, sending yields to their lowest levels in three years, after the government said it would no longer sell its longest-dated security.
The yield on the 30-year bond fell to 4.86 percent just before 3 p.m. ET, its lowest levels since late 1998, amid news of the surprise scarcity. The bond's price, which moved inversely to its yield, surged 5-15/32 to 107-29/32.
Treasury Department officials said they will no longer will issue the 30-year because they don't meet the government's cash needs and discontinuing them will save taxpayers money.
That's in contrast to the expectations of market participants, who had avoided longer-dated bonds on expectations that budget deficits would mean more government borrowing.
"I can't remember the last time we had a five-point rally," Jim Claire, director of fixed income trading at Evergreen Institutional Investments in Charlotte, N.C., told Reuters.
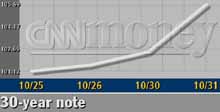
The benchmark 10-year note rose 1-5/32 to 105-25/32, yielding 4.26 percent from 4.42 percent Tuesday.
Two-year notes were little changed, yielding 2.43 percent. Five-year notes rose 10/32 to yield 3.51 percent. Prices for shorter-dated maturities have rallied in recent months as the Federal Reserve cut interest rates.
Separately, the government reported that the economy shrank 0.4 percent in the third quarter, the weakest reading since the last recession, but below the 1.0 percent decrease economists had forecast. The numbers helped deflate some investors' hopes for more aggressive interest-rate cuts by the Federal Reserve.
"It's less negative than expected and that is bad for bonds short-term but I don't think it changes the story," said Jamie Jackson, head of fixed income at Brinson Partners in Chicago.
The GDP report is likely to be followed by other weak data, including an expected dismal report on the U.S. employment situation Friday.
The Fed has cut rates nine times so far this year in a bid to ward off a recession. Lower rates tend to spur the economy and corporate profit growth, and so usually boost stock prices. But lower rates also can fuel inflation, which worries investors who tie up money for long periods in the bond market.
Central bankers are expected to lower rates once again next week.
In other economic data, a survey of purchasing managers in Chicago showed purchasing in October contracted faster than in September, but less than economists expected.
The Chicago purchasing index came in at 46.2, while economists were looking for 43.
On Tuesday, short-dated yields were pinned not far above historic lows following a report that showed consumer confidence took a steep fall in October, boding poorly for consumer spending in the months ahead.
In the currency market, the dollar strengthened. The euro bought 90.02 cents, down from 90.47 Tuesday. The dollar purchased ¥122.34, up from the ¥121.94 at Tuesday's close. 
-- from staff and wire reports
|