graphic
graphic  
graphic
Markets & Stocks
graphic
Bond prices inch lower
graphic December 14, 2001: 3:27 p.m. ET

U.S. Treasurys stumble lower on hopes the economy will soon recover.
graphic
graphic graphic
graphic
graphic
graphic       graphic
  • View the latest market update via Netshow
  • See how your mutual funds are doing
  • Need investing advice?
  • Track your stocks
  •  
    graphic
    NEW YORK (CNN/Money) - U.S. Treasurys fell on Friday after an unexpected spike in core consumer prices in November and a record drop in business inventories spurred selling on hopes the economy will soon recover from recession.

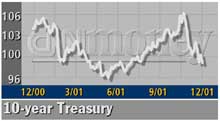
    Two-year Treasury notes were down 6/32 at 99-22/32, yielding 3.16 percent. Five-year notes were down 12/32 at 95-27/32 to yield 4.45 percent. Benchmark 10-year notes fell 19/32 to 98-25/32, yielding 5.16 percent, and 30-year bonds were flat at 97-16/32, yielding 5.55 percent.

    Trading was extremely thin as year-end approaches, leaving prices knocking around in wide ranges, traders said.

    graphic  
    Although many investors believe the Federal Reserve still has room for one more interest rate cut in January, investors have begun to look beyond that to the end of the central bank's aggressive rate-cutting campaign that began early this year.

    "The bond market is adjusting prices because we may be at the bottom end of the interest-rate-cutting cycle," said Alan Day, economist at Banknorth Investment Management Group in Concord, Massachusetts, which has $8.5 billion under management.

    The Fed has cut interest rates 11 times this year, the last time by one-quarter percentage point on Tuesday, bringing the benchmark federal funds rate target to 1.75 percent, its lowest level in four decades.

    Earlier today, the Labor Department said its Consumer Price Index, the most widely used gauge of inflation, was flat last month after declining 0.3 percent in October.

    But excluding lower costs for food and energy items, so-called core CPI climbed a more-than-expected 0.4 percent -- twice the 0.2 percent rise posted in October and the sharpest gain for any month since January 1996.

    A separate report showed business inventories dropped by 1.4 percent in October, the biggest drop on record, while sales spiked 2.7 percent, the largest rise on record.

    Click here for CNN/Money's bond center

    "Both the core CPI being higher and the drop in inventories" triggered selling in Treasurys, said Mike Cloherty, fixed-income strategist at Credit Suisse First Boston. "The drop in inventory-to-sales ratios are positive for the economy."

    In the currency market, the dollar was mixed against the euro and the yen. The euro purchased 90.35 cents, up from 89.28 at Thursday's close. The dollar bought ¥127.45, up from ¥126.05 at yesterday's close.

    -from staff and wire reports graphic

      RELATED LINKS

    View the latest market update via Netshow

    See how your mutual funds are doing

    Need investing advice?

    Track your stocks


    graphic

    Most stock quote data provided by BATS. Market indices are shown in real time, except for the DJIA, which is delayed by two minutes. All times are ET. Disclaimer. Morningstar: © 2018 Morningstar, Inc. All Rights Reserved. Factset: FactSet Research Systems Inc. 2018. All rights reserved. Chicago Mercantile Association: Certain market data is the property of Chicago Mercantile Exchange Inc. and its licensors. All rights reserved. Dow Jones: The Dow Jones branded indices are proprietary to and are calculated, distributed and marketed by DJI Opco, a subsidiary of S&P Dow Jones Indices LLC and have been licensed for use to S&P Opco, LLC and CNN. Standard & Poor's and S&P are registered trademarks of Standard & Poor's Financial Services LLC and Dow Jones is a registered trademark of Dow Jones Trademark Holdings LLC. All content of the Dow Jones branded indices © S&P Dow Jones Indices LLC 2018 and/or its affiliates.

    Most stock quote data provided by BATS. Market indices are shown in real time, except for the DJIA, which is delayed by two minutes. All times are ET. Disclaimer. Morningstar: © 2018 Morningstar, Inc. All Rights Reserved. Factset: FactSet Research Systems Inc. 2018. All rights reserved. Chicago Mercantile Association: Certain market data is the property of Chicago Mercantile Exchange Inc. and its licensors. All rights reserved. Dow Jones: The Dow Jones branded indices are proprietary to and are calculated, distributed and marketed by DJI Opco, a subsidiary of S&P Dow Jones Indices LLC and have been licensed for use to S&P Opco, LLC and CNN. Standard & Poor's and S&P are registered trademarks of Standard & Poor's Financial Services LLC and Dow Jones is a registered trademark of Dow Jones Trademark Holdings LLC. All content of the Dow Jones branded indices © S&P Dow Jones Indices LLC 2018 and/or its affiliates.

    graphic