graphic
graphic  
graphic
News
graphic
3Com net loss narrows
graphic December 18, 2001: 6:57 p.m. ET

The network equipment maker's 2Q results surpass expectations.
graphic
graphic graphic
graphic
NEW YORK (CNN/Money) - 3Com Corp. said Tuesday its second quarter net loss before certain items narrowed from a year earlier, beating analyst expectations, resulting from growing revenue and the effect of earlier cost-cutting measures.

The network equipment maker's net loss before certain items slowed to $47 million, or 14 cents per share, from $51.1 million, or 15 cents a share for the same period last year.

graphic  
The second quarter analysts' estimate was a loss of 22 cents per share, according to tracking firm First Call.

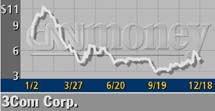
"Q2 was a quarter of great progress for 3Com (COMS: up $0.27 to $5.31, Research, Estimates) ," said Bruce Claflin, 3Com president and chief executive officer. "Our second quarter results confirm we are on or ahead of plan in virtually every part of our turnaround."

Revenue for the quarter was $394 million, a jump from revenues of $390 million in the first fiscal quarter.

The company also reported gross margins of $133 million and operating expenses of $187 million, before certain items.

--from staff and wire reports graphic


graphic

Most stock quote data provided by BATS. Market indices are shown in real time, except for the DJIA, which is delayed by two minutes. All times are ET. Disclaimer. Morningstar: © 2018 Morningstar, Inc. All Rights Reserved. Factset: FactSet Research Systems Inc. 2018. All rights reserved. Chicago Mercantile Association: Certain market data is the property of Chicago Mercantile Exchange Inc. and its licensors. All rights reserved. Dow Jones: The Dow Jones branded indices are proprietary to and are calculated, distributed and marketed by DJI Opco, a subsidiary of S&P Dow Jones Indices LLC and have been licensed for use to S&P Opco, LLC and CNN. Standard & Poor's and S&P are registered trademarks of Standard & Poor's Financial Services LLC and Dow Jones is a registered trademark of Dow Jones Trademark Holdings LLC. All content of the Dow Jones branded indices © S&P Dow Jones Indices LLC 2018 and/or its affiliates.

Most stock quote data provided by BATS. Market indices are shown in real time, except for the DJIA, which is delayed by two minutes. All times are ET. Disclaimer. Morningstar: © 2018 Morningstar, Inc. All Rights Reserved. Factset: FactSet Research Systems Inc. 2018. All rights reserved. Chicago Mercantile Association: Certain market data is the property of Chicago Mercantile Exchange Inc. and its licensors. All rights reserved. Dow Jones: The Dow Jones branded indices are proprietary to and are calculated, distributed and marketed by DJI Opco, a subsidiary of S&P Dow Jones Indices LLC and have been licensed for use to S&P Opco, LLC and CNN. Standard & Poor's and S&P are registered trademarks of Standard & Poor's Financial Services LLC and Dow Jones is a registered trademark of Dow Jones Trademark Holdings LLC. All content of the Dow Jones branded indices © S&P Dow Jones Indices LLC 2018 and/or its affiliates.

graphic