graphic
graphic  
graphic
News > Companies
graphic
Toys 'R' Us reaffirms
graphic January 10, 2002: 2:22 p.m. ET

No. 2 toy retailer cites 2% holiday sales gain; investors aren't impressed.
graphic
graphic graphic
graphic
graphic
graphic       graphic
  • Hot Stocks: Toys 'R' Us; Starbucks; Boeing - Jan. 4, 2002
  • Toys 'R' Us posts narrower 3Q loss - Nov. 19, 2001
  •  
    graphic
    graphic
    graphic       graphic
  • Toys 'R' Us Inc.
  •  
    graphic
    NEW YORK (CNN/Money) - Toys 'R' Us. Inc. reaffirmed its estimates for fiscal 2001 earnings estimates Thursday after reporting a 2 percent increase in sales at stores open at least a year during the holiday period.

    However, the news was not enough to move investors, who sold off the stock, sending it tumbling more than 5 percent in afternoon trading Thursday.

    The Paramus, N.J.-based No 2 toy retailer behind Wal-Mart Stores Inc. said it anticipates fiscal 2001 earnings in line with the 93 cents a share forecast of analysts surveyed by earnings tracker First Call.

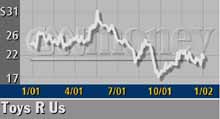
    Toys 'R' Us (TOY: down $1.38 to $20.72, Research, Estimates) cited the popularity of new video game consoles and game titles for driving sales in the holiday period. However, markdowns necessitated by the sluggish economy put pressure on profit margins.

    graphic  
    "Margin pressures were intense in the fourth quarter due to the weighting of video products in our sales mix as well as the highly promotional retail environment," CEO John Eyler said. "These pressures will ease somewhat as the current video cycle matures,"

    The company expects to reduce inventory by about $200 million for the current fiscal year in its U.S. toy stores. graphic

      RELATED STORIES

    Hot Stocks: Toys 'R' Us; Starbucks; Boeing - Jan. 4, 2002

    Toys 'R' Us posts narrower 3Q loss - Nov. 19, 2001

      RELATED LINKS

    Toys 'R' Us Inc.


      graphic


    Most stock quote data provided by BATS. Market indices are shown in real time, except for the DJIA, which is delayed by two minutes. All times are ET. Disclaimer. Morningstar: © 2018 Morningstar, Inc. All Rights Reserved. Factset: FactSet Research Systems Inc. 2018. All rights reserved. Chicago Mercantile Association: Certain market data is the property of Chicago Mercantile Exchange Inc. and its licensors. All rights reserved. Dow Jones: The Dow Jones branded indices are proprietary to and are calculated, distributed and marketed by DJI Opco, a subsidiary of S&P Dow Jones Indices LLC and have been licensed for use to S&P Opco, LLC and CNN. Standard & Poor's and S&P are registered trademarks of Standard & Poor's Financial Services LLC and Dow Jones is a registered trademark of Dow Jones Trademark Holdings LLC. All content of the Dow Jones branded indices © S&P Dow Jones Indices LLC 2018 and/or its affiliates.

    Most stock quote data provided by BATS. Market indices are shown in real time, except for the DJIA, which is delayed by two minutes. All times are ET. Disclaimer. Morningstar: © 2018 Morningstar, Inc. All Rights Reserved. Factset: FactSet Research Systems Inc. 2018. All rights reserved. Chicago Mercantile Association: Certain market data is the property of Chicago Mercantile Exchange Inc. and its licensors. All rights reserved. Dow Jones: The Dow Jones branded indices are proprietary to and are calculated, distributed and marketed by DJI Opco, a subsidiary of S&P Dow Jones Indices LLC and have been licensed for use to S&P Opco, LLC and CNN. Standard & Poor's and S&P are registered trademarks of Standard & Poor's Financial Services LLC and Dow Jones is a registered trademark of Dow Jones Trademark Holdings LLC. All content of the Dow Jones branded indices © S&P Dow Jones Indices LLC 2018 and/or its affiliates.

    graphic