|
Losses fill skies in 4Q
|
 |
January 16, 2002: 2:21 p.m. ET
American, TWA parent posts $734M operating loss; Continental loses $220M.
|
NEW YORK (CNN/Money) - Two of the nation's biggest airlines posted nearly $1 billion in fourth-quarter losses between them Wednesday, although both AMR Corp. and Continental Airlines came in with losses somewhat less than Wall Street forecasts.
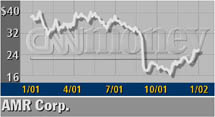
AMR, the world's largest airline company and owner of both American Airlines and Trans World Airlines, lost $734 million for the quarter, ended Dec. 31, or $4.75 a share, excluding one-time items. A year earlier, the company earned $56 million, or 34 cents a share,. The loss was narrower than Wall Street forecasts of $5.08 a share, according to First Call.
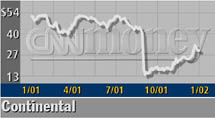
At Houston-based Continental, the nation's No. 5 airline posted a loss of $220 million, or $3.81 a share, excluding special items and federal assistance. That's less than the First Call forecast of a loss of $4.49 a share. The company earned $39 million, or 61 cents a share, on the same basis a year earlier.
Shares of both AMR (AMR: up $0.20 to $25.99, Research, Estimates) and Continental (CAL: up $1.48 to $30.87, Research, Estimates) were higher in midday trading on a mixed day overall for airline stocks.
Including the special items, AMR posted its largest quarterly loss ever of $798 million, or $5.17 a share, compared with a profit of $47 million, or 29 cents a share, a year earlier. Special items included charges of $93 million, or 61 cents a share, for write-off of aircraft, costs to exit facilities, severance expenses for furloughed employees as well as direct assistance from the federal government of $29 million, or 19 cents a share.
AMR also said it has decided to phase out its Boeing 717s, 100-seat jets brought into its fleet with the acquisition of TWA last year, to reduce the number of aircraft types in its fleet. An agreement with Boeing Co. (BA: down $0.91 to $38.44, Research, Estimates) will allow it to make the move sooner than originally planned.
A spokesman for Boeing said that TWA had 30 of the 717s in its fleet and that 24 will be returned to Boeing for resale to other airlines. He said the other six were owned by an aircraft lessor and that he believed those aircraft will also be returned and sold. A spokesman for AMR could not be reached for comment.
Fourth-quarter revenue for AMR tumbled 22 percent to $3.8 billion from $4.9 billion. The addition of TWA, which continues to operate separately and had passenger revenue of $414 million, mitigated a 31 percent drop in passenger revenue at American Airlines. Besides the overall drop in air traffic, a sharp drop in business travel drove fares down in the quarter. The average fare paid by American Airlines customers per mile flown fell 15 percent from a year earlier.
AMR's total fuel costs fall 22.6 percent, and it saved nearly $100 million from lower commissions paid to travel agents. But other operating costs rose. While the combined company announced staff cuts of about 20 percent of its staff shortly after the Sept. 11 attack, the addition of 14,100 TWA employees to the company compared with a year ago kept the number of full-time equivalent employees at 109,300, up from 107,400 a year ago. Total wages and benefit costs in the quarter were 14.5 percent above a year ago.
Continental sees signs of recovery
Continental posted a fourth-quarter net loss of $149 million, or $2.58 a share, Including the $174 million it received in federal assistance. That contrasts with a profit of $44 million, or 70 cents a share, a year earlier.
Revenue fell 28.4 percent to $1.6 billion, as both miles flown by paying passengers and the amount paid per mile fell from a year earlier. But both those key measures showed less of a year-to-year decline in December than they did in October, as the company said it is seeing signs of a steady recovery.
The company was able to raise $172 million through a secondary stock offering during the quarter and said it ended the year with $1.13 billion in cash and short-term securities. The company also said it still plans to sell Continental Express, its regional feeder airline, through an initial public offering. The company had announced that plan before the Sept. 11 attack.
Click here for a look at airline stocks
Before the attack only Continental and discount carrier Southwest Airlines (LUV: down $0.13 to $17.94, Research, Estimates) had been forecast to make money for the full year as a sharp drop in business travel and fares and higher labor costs had hurt industry profitability even before the attack. But Continental ended up with an operating loss for the year of $266 million, or $4.79 a share. 
|
|
|
|
|
|

|