NEW YORK (CNN/Money) - U.S. Treasurys suffered losses Thursday after a key gauge of regional manufacturing turned positive for the first time in more than a year, causing investors to reconsider whether the Federal Reserve will cut interest rates again at month's end.
At 2:45 p.m. ET,� two-year notes were down 8/32 at 100-20/32, yielding 2.91 percent, and five-year notes were down 16/32 at 96-30/32, yielding 4.20 percent.
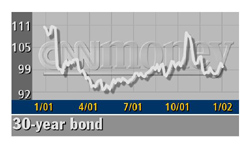
Benchmark 10-year notes were down 21/32 at 100-18/32, yielding 4.92 percent, and 30-year bonds were down 25/32 at 99-20/32 , yielding 5.40 percent.
Treasury bonds fell a full point after the Federal Reserve Bank of Philadelphia said its business conditions index surged to 14.7 in January -- far outpacing Wall Street forecasts for minus 4.1. In December, the index read minus 12.6.
"It was a strong number across the board," Andrew Hunt, senior vice president at Salomon Smith Barney in Chicago said of the Philadelphia Fed data. "Manufacturing is definitely a place where we're seeing some strength and the market is now taking the Fed out of the equation to some extent."
Hunt expected short-dated Treasury securities to weaken until the market sees more data. A strong reading from the University of Michigan's consumer sentiment index Friday could fuel the view the Fed may not need to cut rates again when it meets on Jan. 29-30, he said.
Prior to the data's release, the market had been under pressure as stocks rebounded after Wednesday's steep losses and after the government said U.S. weekly jobless claims fell to their lowest level in six months.
Traders said prices also retreated as dealers made room for a throng of corporate supply and $25 billion in two-year notes that the Treasury is scheduled to sell next week.
"You've got stocks doing better, you've got supply coming -- the announcement that we're going to have a fairly large two-year sale -- and that's weighing down the market," said David Coard, head of fixed-income sales and trading at The Williams Capital Group.
The economic data the market got early Thursday were mixed, with housing starts down 3.4 percent in December, weaker than economists had forecast. But new claims for state unemployment insurance in the week ended Jan. 12 fell to 384,000, the lowest level in nearly six months, from a revised 398,000 a week earlier.
�Dollar up against euro, yen
In the currency market, the dollar gained against the euro and the yen.
At 2:45 p.m. ET, the euro was quoted at 88.17 U.S. cents, down from 88.24 cents� late Wednesday.
The dollar bought ¥132.37, up from ¥132.02. 
--from staff and wire reports
|