graphic
graphic  
graphic
Technology
graphic
Dell sees stronger 4Q
graphic January 18, 2002: 11:28 a.m. ET

Strong consumer sales leads to upside in earnings, revenue.
graphic
graphic graphic
graphic
NEW YORK (CNN/Money) - Dell Computer said Friday it expects to report fiscal fourth-quarter sales and earnings that are above Wall Street's current expectations.

The No. 1 maker of personal computers said its expects to log a profit of 17 cents per share on $8 billion in revenue when it reports its results on Feb. 14. Wall Street recently had forecast a profit of 16 cents per share $7.7 billion in sales, according to First Call.

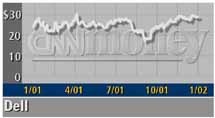
Dell (DELL: down $0.47 to $28.48, Research, Estimates) credited stronger-than-expected consumer sales for the upside surprise.

The Austin, Tex.-based direct seller of PCs has been something of a standout in the industry over the past year.

graphic  
Recent industry reports show that year-over-year global PC shipments fell in 2001, with especially steep declines in the United States. Those same reports showed Dell as the only top-tier vendor to increase shipments on a year-over-year basis both in the United States and globally.

The company's performance was especially strong in the fourth quarter. By International Data Corp.'s count, Dell garnered 14.2 percent of the global PC market share, while its total unit shipments rose 13.5 percent from the same quarter in 2000.

At the same time, Compaq, which garnered 11.2 percent of the worldwide PC market, saw its total unit shipments decline 19.1 percent.

Analysts credited Dell's efforts to expanding its segment coverage and leveraging its direct business model to keep the pressure on its competitors.

Shares of Dell (DELL: down $0.45 to $28.50, Research, Estimates), which have risen about 9 percent over the past year, were trading lower on Nasdaq early Friday amid a broader downturn in technology stocks. graphic


graphic

Most stock quote data provided by BATS. Market indices are shown in real time, except for the DJIA, which is delayed by two minutes. All times are ET. Disclaimer. Morningstar: © 2018 Morningstar, Inc. All Rights Reserved. Factset: FactSet Research Systems Inc. 2018. All rights reserved. Chicago Mercantile Association: Certain market data is the property of Chicago Mercantile Exchange Inc. and its licensors. All rights reserved. Dow Jones: The Dow Jones branded indices are proprietary to and are calculated, distributed and marketed by DJI Opco, a subsidiary of S&P Dow Jones Indices LLC and have been licensed for use to S&P Opco, LLC and CNN. Standard & Poor's and S&P are registered trademarks of Standard & Poor's Financial Services LLC and Dow Jones is a registered trademark of Dow Jones Trademark Holdings LLC. All content of the Dow Jones branded indices © S&P Dow Jones Indices LLC 2018 and/or its affiliates.

Most stock quote data provided by BATS. Market indices are shown in real time, except for the DJIA, which is delayed by two minutes. All times are ET. Disclaimer. Morningstar: © 2018 Morningstar, Inc. All Rights Reserved. Factset: FactSet Research Systems Inc. 2018. All rights reserved. Chicago Mercantile Association: Certain market data is the property of Chicago Mercantile Exchange Inc. and its licensors. All rights reserved. Dow Jones: The Dow Jones branded indices are proprietary to and are calculated, distributed and marketed by DJI Opco, a subsidiary of S&P Dow Jones Indices LLC and have been licensed for use to S&P Opco, LLC and CNN. Standard & Poor's and S&P are registered trademarks of Standard & Poor's Financial Services LLC and Dow Jones is a registered trademark of Dow Jones Trademark Holdings LLC. All content of the Dow Jones branded indices © S&P Dow Jones Indices LLC 2018 and/or its affiliates.

graphic