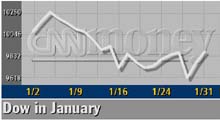
NEW YORK (CNN/Money) - Big gains in Procter & Gamble propelled the Dow Jones industrial average higher Thursday in a rally unable to save the stock market from a losing month.
That may bode poorly for stock investors smarting from two straight money-losing years. Since 1950, the market's direction in January has presaged the course of the year 80 percent of the time, according to the Stock Trader's Almanac.
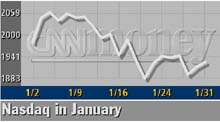
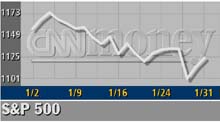
The Dow industrials gained 157.14 points, or 1.6 percent, to 9,920.00, narrowing its January loss to 1 percent. The Nasdaq composite index rose 20.68, or 1.1 percent, to 1,934.12, and is down 0.8 percent on the month. Off 1.7 percent in January, the Standard & Poor's 500 index added 16.64, or 1.5 percent, to 1,130.21.
Thursday's gains lacked the suddenness of Wednesday's, when a Federal Reserve decision to leave interest rates unchanged sparked a late-session rally. And the advance masked some of the accounting worries that haunted investors earlier this week
"Investors are looking at this market and taking a step back," Nick Angilletta, trader at Salomon Smith Barney, told CNNfn's Street Sweep.
The session brought more promising economic data, ahead of Friday's closely watched January jobs report. Manufacturing conditions around Chicago rose in January, while new jobless claims and personal income revealed signs of strength.
More stocks rose than fell. On the New York Stock Exchange, advancing shares topped declining ones 2-to-1 as 1.5 billion shares changed hands. Nasdaq winners beat losers 3-to-2 as 1.7 billion shares traded.
In other markets, Treasury securities were mixed. The dollar rose against the yen and euro.
Rising tide
Second-quarter profit at Procter & Gamble (PG: up $3.39 to $81.68, Research, Estimates) topped forecasts, rising to $1.03 a share, as the maker of Pampers, Tide, and Crest said it's on track to meet forecasts for its current fiscal year. The gain took P&G stock within pennies of a new 52-week high.
Intel (INTC: up $1.18 to $35.04, Research, Estimates) , another Dow stock, rose after Merrill Lynch upgraded the No.1 chipmaker to "strong buy"� from "buy," saying the launch of its new micron chip would boost profit margins.
Oracle (ORCL: up $0.64 to $17.26, Research, Estimates) told analysts it sees its software business picking up by this spring, though the company doesn't predict a fast return to normal economic conditions.
Only three Dow stocks fell. One of them, Walt Disney (DIS: down $0.34 to $21.06, Research, Estimates) �posted a first-quarter profit of 15 cents per share after the markets closed that was down sharply from a year ago but ahead of Wall Street estimates.
But Tyco International (TYC: up $0.30 to $35.15, Research, Estimates) continued to bounce back. Two company executives said they would buy 1 million Tyco shares, which are still down 39 percent this year amid questions about accounting accuracy.
Worries that companies are hiding unpleasant financial news from investors have hurt stocks in recent days.
Anadarko Petroleum (APC: up $2.24 to $49.13, Research, Estimates) and PNC Financial (PNC: up $2.04 to $57.75, Research, Estimates) restated quarterly results this week, and Williams Cos. (WMB: down $0.32 to $17.68, Research, Estimates) issued partial data as it tried to sort through bookkeeping issues.
But some analysts say investors have linked too many companies to Enron, which downwardly revised its results before going bankrupt in December.
"There's still some overhang from the accounting worries out there," Barry Hyman, chief investment strategist at Ehrenkrantz King Nussbaum, told CNNfn's Market Call.
McLeodUSA (MCLD: unchanged at $0.18, Research, Estimates) , the Midwest telephone company, became the latest company to file for bankruptcy this year, joining Kmart (KM: up $0.10 to $1.49, Research, Estimates) and Global Crossing (GX: unchanged at $0.30, Research, Estimates) .
Economic data mostly positive
New economic data signaled the economy may have bottomed. The Chicago Purchasing Managers' manufacturing index rose 3.6 points to 45.1 in January.
Earlier, the government said the number of Americans filing for first time jobless claims rose by 30,000 to 390,000 last week, but the four-week moving average of claims fell to its lowest level since August, a sign that the labor market has stabilized.
December personal income rose 0.4 percent, the first gain since August, while consumer spending fell 0.2 percent.
By leaving interest rates steady Wednesday, the Fed signaled that the economy may be on the mend following last year's 11 rate cuts. Stocks rallied after the decision, which may mark the end of the Fed's year-long rate-cut campaign.
Minutes released Thursday showed that one Fed official, Kansas City Fed President Thomas Hoenig, voted against cutting rates when the Fed cut borrowing costs in December.
Friday brings more economic data. The nation's unemployment rate is expected to rise to 5.9 percent in January from December 5.8, according to the consensus of economists surveyed by Briefing.com. The pace of job losses is expected to continue to slow.
In Friday's other main report, nationwide manufacturing, as measured by the Institute for Supply Management, is forecast to grow for the first time in 18 months in January.
Investors worried about the January Barometer's market effect can take heart in last year. The S&P 500 rose 3.5 percent a year ago January only to fall 13 percent in 2001, in what the Stock Trader's Almanac called one of only four "major errors" for the indicator. 
Click here to send mail to Jake Ulick
|