|
Favorite Stock: Goldcorp
|
 |
February 7, 2002: 12:48 p.m. ET
Conti singles out the North American gold producer as a classic growth company.
By Staff Writer Parija Bhatnagar
|
NEW YORK (CNN/Money) - This week's spectacular gold rush has rubbed the tarnish off of the precious metal. Investors nervous about the spread of accounting shenanigans and dwindling stock prices, fled to the safety of solid assets.
But while gold prices shot to two-year highs, analysts say that's not the only story here. There's also the hectic jockeying to conquer and combine global gold producers.
Barrick Gold (ABX: up $0.81 to $18.77, Research, Estimates) merged with Homestake Mining in December. Newmont Mining (NEM: down $0.17 to $24.13, Research, Estimates), the world's largest gold miner, is locked in a protracted four-month battle with South Africa's AngloGold for Australia's largest gold producer, Normandy Mining.
"There's been a wave of consolidation in the sector over the last year," said Amaury de Barros Conti, gold trader with U.S. Global Investors. "The world's gold producers have been functioning in survival mode for a few years. They've had to deal with the same issues as other base metal companies -- shaky demand, falling prices for commodities and criticism for being a waste of capital and destroying shareholder value. That's changing."
| |

|
|
Amaury de Barros Conti, gold trader with U.S. Global Investors. | |
Conti says rising gold prices going into 2002 reflects that trend towards consolidation and could further spur merger and acquisition activity if gold prices hold above the $300 an ounce mark, or jump higher. Additionally, higher prices also makes gold mining profitable.
"Many exploration projects require a gold price of $350 or higher to be profitable, and I believe that larger companies will look to grow through acquisitions of other smaller companies which are making money, have� mines, and ongoing projects," Conti said.� "The trend will continue."
And that's a good thing for the sector, according to Conti, because consolidation will allow gold miners and producers to achieve cost efficiency, economies of scale, and hedge against a drop in price of commodities.
"Also something that we haven't had for a while in the sector is actual leverage to gold price, which has the potential to go higher over the next few months," he said.
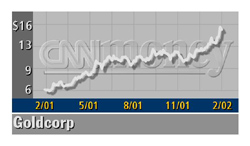
Conti singles out the North American based gold producer Goldcorp as a classic growth company and a good defensive play for investors to look out for that has the production base to increase cash flows and bolster reserves.
Conti expand on why he favors Goldcorp (GG: up $0.92 to $16.22, Research, Estimates) �as his top stock pick:
Goldcorp is currently trading just shy of its 52-week high at $15.62. Why do you like this company?
We like this gold stock because it is one of the few growth stories in the gold sector. Also, the company is debt-free, unhedged, liquid, and has demonstrated its ability to increase cash flow, reserves, and production levels despite a relatively low gold price.
Its forecasted gross margin for 2001 is expected to reach 65 percent, net profit 31 percent, and return on equity of 33 percent. As of September 2001, the company had $70.2 million in cash and 82.5 million shares outstanding.
The company reported a fourth-quarter profit Friday of $12.2 million, or 15 cents per share, compared with a loss of $13.6 million, or 17 cents per share, in the fourth quarter of 2000. Analysts had forecast a profit of 14 cents a share, according to earnings tracker First Call.
Who are its competitors in the sector?
While it is not a senior gold producer, its direct competitors are Meridian Gold (MDG: up $0.86 to $13.91, Research, Estimates) and Agnico-Eagle. But the whole industry is within what I would qualify its main competitors.
Goldcorp's main operation is a high-grade Red Lake mine in Ontario, Canada, with high-grade reserves estimated to be in excess of 3 million ounces, and the Wharf Mine in South Dakota, which produces about 100,000 ounces of gold annually.
Gold production for 2001 is expected to be 600,000 ounces at a cost of $65 an ounce. The company has also pushed for innovative exploration and production programs.
For 2001, the Philadelphia Gold and Silver Index ($XAU: Research, Estimates) was up 5.87 percent, while the S&P 500 declined 13.04 percent, and Goldcorp jumped as much as 100.7 percent.
Year-to-date, as of Wednesday's close, the Philadelphia Gold and Silver Index was up 24.62 percent, the S&P 500 down 5.06 percent, and Goldcorp up 34.35 percent.
What is your outlook for the sector?
There is definitely a sentiment change within gold companies as they re-evaluate their hedging programs from an economic standpoint. Gold stocks have done extremely well in the month of January, hitting double-digit (percentage) gains.
In the past, companies have been able to reliably and consistently increase their revenues by selling some of its gold in the future at a predetermined price, mostly at a premium to the spot price they would otherwise receive.
Also, they could turn around and invest that cash in government bills and other government instruments and earn a nice interest on that cash, almost risk-free.
Click here to check on commodities
Given the fact that the Federal Reserve cut interest rates 11 times, the interest earned, as well as the anticipation of higher gold prices in the future is reducing the attractiveness of these forward hedging programs.
We've also witnessed a recent surge in gold price from moves to safety on heightened concerns over corporate accounting issues, the state of the Japan economy, and the stability and recovery of the U.S. economy. We also witnessed some decent gold demand from Asia.
From a macro perspective, gold is historically negatively correlated with the U.S. dollar, and some people believe the dollar is at a record high and will weaken over the rest of the year as investors look to place money in other countries that have higher growth.
What is your financial interest in the stock?
We do own the stock and look for the company to continue its growth strategy and increase shareholder value.
Final thought?
While I could see some consolidation in the gold price around the $295 to $300 range, I like the metal as a continued alternative asset class to investors as well as the fact that we will see a peak in gold production this year.
Investors should consider allocating about 5 percent of their portfolio into gold stocks, which provide defensive positions and diversification. 
|
|
|
|
|
|

|