|
U.S. bonds retreat on data
|
 |
February 7, 2002: 3:37 p.m. ET
Treasurys see selloff on upbeat weekly unemployment data, equity shakiness.
|
NEW YORK (CNN/Money) - U.S. Treasurys slid Thursday after stocks struggled to find direction and new weekly data on unemployment claims showed a continued decline, hinting at a firming labor market.
At 3:00 p.m. ET, two-year notes were off 1/32 at 100-2/32, yielding 2.97 percent, five-year notes were down 3/32 at 96-27/32, yielding 4.24 percent.
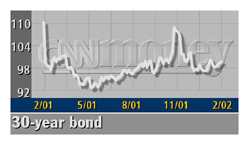
The benchmark 10-year note was down 7/32 at 99-18/32, yielding 4.93 percent, and 30-year bonds fell 21/32 to 99-13/32 to yield 5.42 percent.
The Labor Department reported that the number of Americans filing new claims for unemployment benefits fell to 376,000 last week from a revised 391,000 the preceding week. Economists surveyed by Briefing.com expected 388,000 new claims last week.
Dealers were trying to sell government securities they bought in the Treasury's refunding auctions.
"We're down for three reasons. One, we still have the overhang of supply associated with the February refunding auctions, which were not distributed that well," said William Sullivan, executive director of money market research at Morgan Stanley. "Two, the early gains in the Dow Jones industrial average have eliminated some support for Treasury."
Third, the weekly drop in jobless claims reported by the Labor Department seemed to signal a turnaround in labor market conditions, Sullivan added.
William Hornbarger, chief market strategist at A.G. Edwards & Sons, said economic data seem to be saying that the economy is a bit stronger and as a result, when Treasurys break out of their ranges, "it will be toward higher yields."
Dollar in tight range against euro, yen
A tug-of-war in the foreign exchange market on Thursday kept currencies hemmed in tight ranges against the dollar as investors balanced firmer U.S. stock prices against an unfolding accounting scandal.
Investors shrugged off good news on the U.S. jobs front as well as the widely expected decision by the European Central Bank to leave interest rates unchanged at 3.25 percent.
Caution ahead of an upcoming weekend meeting of finance ministers from the Group of Seven major industrialized countries and the lingering concerns of potentially more accounting scandals in the wake of once-powerful energy trading company Enron placed investors in a holding pattern.
"It dawned on the market that it was conceivable that there was more to the story than met the eye. And then you're in a difficult situation," said Paul Podolsky, currency strategist at Fleet Global Markets.
"This is about trust, this system. So the question is how you price that, and it's given the foreign exchange market pause," said Podolsky.
At 3:00 p.m. ET, the euro bought 87.10 U.S. cents, down from 86.71 U.S. cents late Wednesday.
The dollar was quoted at ¥133.59, up from ¥133.69 late Wednesday.
Gold futures rose $2.50 an ounce to $300.80 in Chicago. 
-- from staff and wire reports
|
|
|
|
|
|

|