NEW YORK (MONEY Magazine) -
It was straight out of Ripley's. When MONEY Magazine asked Ned Davis Research this summer to compile a list of the 30 best-performing stocks since the magazine's debut in 1972, it seemed obvious that the No. 1 performer would reflect the brawn-to-brains transformation of the U.S. economy.
Probably a technology stock. Or maybe a big name in pharmaceuticals. What we were not expecting was an airline -- Southwest Airlines, to be precise.
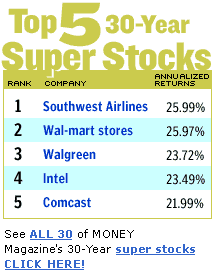
Since August 1972, Southwest has produced annualized returns of 25.99 percent, which means that had you invested $10,000 in Southwest 30 years ago, your stake would be worth a little over $10.2 million today.
Southwest, of course, is not your typical airline, and the now-retired Herb Kelleher was never your typical airline CEO.
As other carriers got bogged down with labor strife and the high cost of maintaining regional hubs, Kelleher built Southwest into a model of efficiency and customer service in an industry known for neither.
| Also in this series
|

|
|
|
|
Still, what exactly does it say about investing when the best-performing stock over the past 30 years hails from such a pathetic industry? Ever since deregulation, airlines have been beset by high-profile bankruptcies (TWA and US Airways are just the latest), and the industry is now only one more bad year away from the historical ignominy of having lost more money than it's ever made.
"When you think about it, it is absolutely remarkable that Southwest could come out No. 1 despite being in probably the worst industry in America," says Jeremy Siegel, Wharton finance professor and author of "Stocks for the Long Run." "What it tells me -- and what it should tell your readers -- is just how valuable a good CEO with good strategies can be."
Management counts
To us, that's the big lesson here: that the quality of a company's management -- not necessarily the growth potential of its industry -- is the key to predicting long-term success in the stock market. We realize how heretical this sounds. Investors tend to chase macroeconomic trends, throwing their money at whatever is hot or new.
In 1972 you'd have been laughed off the trading floor had you predicted that Walgreen (No. 3 on our list) would be a better pick than Pfizer or that Kroger (No. 9) would outperform IBM.
What our list demonstrates is how misguided this approach is for buy-and-hold investors. It is no coincidence that our top 30 list is packed with fascinating management stories, from Kelleher's triumph at Southwest to Nucor's rise from the ashes of a left-for-dead steel industry. Technology changes. Economic cycles come and go.
But it seems that good management never goes out of style. "Well-run companies don't have to be perfectly positioned along the industrial spectrum," says David Testa, chief investment officer at T. Rowe Price. "These stocks on your list are not meteors. They are companies that ground it out the hard way."
When you think about it, it makes sense that such companies would be the ultimate winners. If we learned anything from the excesses of the 1990s, it's that the correlation between great companies and a couple of great years in the stock market can be shockingly low. AOL, Lucent, Sun and Yahoo were some of the top stocks of the late 1990s. How many of them would you still want to own today?
The reason short-term returns are so misleading -- and why we think our 30-year numbers tell more about the art of investing -- is that so much of what drives short-term performance is happenstance.
Consider the best-performing stock over the past 12 months, Invision Technologies. Invision may be a fine little company, but it would be crazy for investors to draw any broad lessons from Invision's 1,000 percent-plus returns. The company makes explosives-detection technology. Talk about timing. Unless you are a psychic, however, being in the right place at the right time is hardly a viable strategy for building a successful stock portfolio.
Obviously, nobody could have predicted in 1972 that Southwest or Wal-Mart -- which at No. 2 would have turned a $10,000 investment into $10,186,000 -- would perform so well. Though much admired today, these companies weren't even on most radar screens back then.
In 1972, Wal-Mart operated in just five states (Arkansas, Kansas, Louisiana, Missouri and Oklahoma), while Southwest's fleet consisted of three airplanes. What distinguishes these companies from the Invisions and Yahoos is that investors didn't need to get in early to make a lot of money.
If you bought Southwest and Wal-Mart 10 years ago, you've been rewarded with total returns of 401 percent and 294 percent, respectively, compared with 149 percent for Standard & Poor's 500-stock index. Over the past five years: 122 percent and 208 percent vs. 2 percent for the S&P.
Indeed, consistency is a hallmark of the entire top 30. As a group, they've returned 345 percent over the past 10 years, 80 percent over five years and -4 percent so far this year (vs. -21 percent for the index).
Some things to consider when looking at the list. Because of its start and end dates (August 1972 through July 2002), the list excludes top stocks that were not publicly traded in 1972, such as Dell (which went public in 1988), Home Depot (1981) and Microsoft (1986). Also, while Ned Davis has highly reliable 30-year statistics, the firm's database includes only those companies that have traded on a major exchange throughout the 30-year period and have, at some point, been included in the S&P 500.
Also contributing to this story were Aravind Adiga, Adrienne Carter, David Futrelle, Erica Garcia, Lisa Gibbs, Maya Jackson, Jeanne Lee, Jeff Nash, Nick Pachetti, Ilana Polyak, Stephanie D. Smith and Cybele Weisser.

|