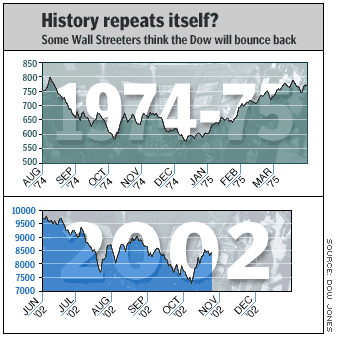
NEW YORK (CNN/Money) - Wall Street has lately been squeezing itself into an old leisure suit, popping "Band on the Run" onto the hi-fi, and swearing to itself that things look just like they did when the market hit bottom in 1974. Unfortunately, the comparison may be as misplaced as an aging baby-boomer at an Eminem concert.

It sure would be groovy if it were 1974 all over again. In December of that year, the Dow Jones careened to its lowest close in over a decade. Gloom was pervasive -- President Nixon had resigned back in August, inflation was out of control and the country was in the midst of the longest recession since the 1930s. And, as often occurs when negativity runs to such extremes, stocks turned and ran the other way. The rally off the bottom was one of the greatest in history. Half a year later the Dow was up 45 percent.
To some minds, the market's drop to new lows earlier this month is strikingly similar to what happened in 1974. No, the particulars weren't exactly the same (instead of Nixon there were guys like Dennis Kozlowski; instead of inflation, there were worries about deflation), but the negativity that suffused the market sure was striking the same chord.
Moreover, stocks' action in 1974 matches up well with what's happened recently.
"It's a very dramatic similarity," said Raymond James market analyst Ralph Bloch. "You could almost superimpose the charts on top of one another."
Back then, stocks fell sharply into the beginning of October, had a big bounce-back, dropped to new lows and rallied hard. The depths of the declines are similar, too: the benchmark S&P 500 was 46 percent off its highs at the 1974 bottom; this time it was 49 percent off its top.
The drop-bounce-drop-rally pattern -- what people call a double-bottom -- is how most major market bottoms get put in, according to Bloch. The idea is that the first bounce comes when a raft of deep-pocketed, long-term investors, called strong hands, see stocks as bargains and come into the market. The market falls again, and again the strong hands start buying.
This year, after hitting its low on Oct. 9, the Dow is up 16 percent. And the implication is, the rally ain't over.
There's just one big problem with the 1974 analogy: Where's the money going to come from?
Money, it's a gas
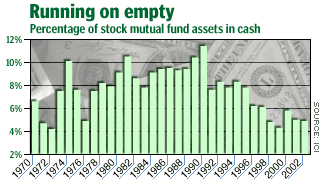
Back when the rally started in 1974, there was scads of cash on hand to throw at stocks. According to the Investment Company Institute, 10.7 percent of equity mutual fund assets were in cash at the end of that November. By June 1975, cash levels had fallen to 6.8 percent.

These days, fund managers aren't nearly so flush. Investors have steadily shifted their money toward fixed-income and money-market funds, and equity funds have barely been able to keep pace with the selling. At ICI's last sounding, in August, only 4.9 percent of equity fund assets were in cash. That's not much higher than the low of 4 percent they hit in March, 2000, the month the stock bubble burst.
"Cash levels are very low," said J.P. Morgan equity strategist Carlos Asilis. "The bullish case is to say that money-market fund levels are very high, which means that investors have the wherewithal to rotate back into equities. My take on that is I wouldn't hold my breath."
Individual investors, thinks Asilis, are too worried about the still-weak economy to commit money to the market. Also, notes Miller Tabak technical analyst Philip Roth, individual investors tend to respond to past performance.
The biggest inflows ever came in 2000, when $309 billion poured into equity funds. Investors were responding to the huge gains the market had seen through the late 1990s, capped off by 1999's 25 percent gain in the Dow and 86 percent jump in the Nasdaq. It was one of the worst times in history to put money into stocks.
Now, on the heels of the worst market decline since the 1930s, it will take a lot to convince investors to pull their cash out of money-market accounts and put them in equity mutual funds again. Terrific as the rally has been, when investors look at their statements at the end of the year, they'll still be deep in the red. And note that even the big rally that started in 1974 failed to draw cash into mutual funds. It wasn't until stocks moved forcefully to new highs, in the early 1980s, that investors began to shift money toward equity mutual funds again.
"There's no way in hell cash is about to come roaring back into the market," said Roth.

|

