NEW YORK (CNN/Money) - Think now that business-friendly Republicans are in control of government, Wall Street is going to shake off its blues and embark on a steady, lasting rally? Not so fast.
| POLITICIANS VS. MARKET
|

|
|
|
|
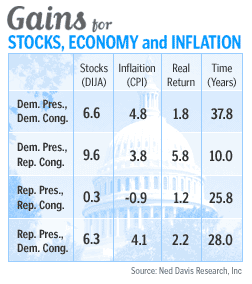
Since 1900, Republicans have been in control of both houses of Congress and the presidency three times for a total of 23.8 years -- or 25.8 including the past two years with a legislative majority. Wall Street's gain during this time? A meager 0.3 percent.
This rate of gain is much lower than that during strictly Democratic governments, or any combination of the two main parties.
"I think that one of the lessons in history is that if any party has too much control, the danger is that they will go overboard," said Robert Brusca, chief economist at Ecobest Consulting. "The challenge for this administration is going to be to keep control of things."
Republican president and Congress bring meager returns
During the times when a Republican president and Congress were in charge of the country, according to Ned Davis Research, the Dow rose 0.3 percent and inflation fell 0.9 percent -- leaving a real rate of return in the stock market of 1.2 percent.
Republicans won control of the government in 1900 when William McKinley was re-elected, continued with it after his assassination, under Teddy Roosevelt, and running into the early administration of William Taft. The party's power took up again in 1921 under Warren G. Harding -- running through the administrations of Calvin Coolidge and Herbert Hoover -- and then again in 1953 for two years under Dwight D. Eisenhower.
While the numbers may lead some to believe the next two years could be more of the same, others don't trust the data.
"I think rules are made to be broken and history isn't always a perfect guide," said Brian Wesbury, chief economist at Griffin, Kubik, Stephans & Thompson. "Today the stock market is very undervalued. As I look into the future, the gains of the past few weeks are a precursor to what is going to happen in the future."
During the 28 years of control by a Republican president and a Democratic Congress, the Dow rose an average of 6.3 percent. Incorporating a 4.1 percent inflation rate, the real rate of return comes in at 2.1 percent , or 0.9 percent better than a with Republican president and Republican Congress majority, according to Ned Davis Research.
Control of Congress and the presidency by Democrats has historically yielded a 6.6 percent average gain on the Dow but a 4.8 percent inflation rate -- meaning the real rate of return falls to 1.8 percent, below those years when Republicans led the executive branch and Democrats the legislative.
But coming in above all, on average, are the few years when a Democratic president was forced to work with a Republican Congress -- spanning the administrations of Woodrow Wilson, Harry Truman and the last six years of Bill Clinton's presidency. During these years, the market gained 9.6 percent and the inflation rate was 3.8 percent, for a 5.8 real rate of return.
Despite the data, economists tend to agree that policy will be more important moving forward than which party is in the White House or holds the majority in Congress. And some even said that the markets have edged higher recently, logging four consecutive weeks of gains, in anticipation of this new-found Republican majority in the House and Senate.
"I do believe we're going to have better policies for the markets moving forward," Wesbury said. "I think we already saw the market move up in expectation of this."

|