New York (CNN/Money) Is the housing market starting to crack? The answer depends on who you ask.
This week, the Office of Federal Housing Enterprise Oversight (OFHEO) released its most current housing price data, suggesting the robust real estate market is showing early signs of weakness.
Specifically, while third quarter housing prices rose a robust 6.16 percent over the same quarter last year, prices crept up just 0.84 percent over the second quarter of this year. That's far slower than the 2.39 percent national home price increase reported from April to June this year.
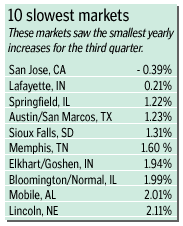
Moreover, seven states Vermont, Illinois, Kansas, Michigan, Wisconsin, South Dakota and Alaska reported negative quarterly growth. And 33 of the 185 local housing markets that OFHEA studies saw home prices slide for the quarter, as well.
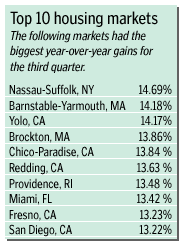
The report was far less bullish than one released last month by the National Association of Realtors, which found that home prices in the third quarter soared 7.2 percent from the year before and that only seven housing markets saw prices slip. For more on the NAR report, see"Housing prices sizzle."
Record keeping skews results
Blame the difference on record keeping.
Here's why. NAR tracks the housing market by comparing the median price of homes sold in a specific area over a fixed period of time. The federal government, and other economists, prefer to compare sales prices for individual homes over time. Such repeat sales data, they contend, is more accurate than median prices.
But the government's data isn't flaw-free either. OFHEA, for example, only tracks data for single-family homes, not apartments or condominiums. And it only looks at homes that had conventional mortgages under $300,700 and that were handled through Fannie Mae or Freddie Mac. That would exclude many high-priced homes in rich markets like Northern California's Bay Area, New York and Boston, where prices have soared in recent years.
You have the data. Now what?
So, what to do if you're considering buying or selling?
Regardless of who keeps the data, focus on local statistics when determining if you may be in for a housing cool-down. Look at how houses are selling near you. And keep an eye on external factors that could dampen the market, such as higher interest rates or how the local economy is faring, said Stephen Cauley, an economist at University of California Los Angeles.
For more on the type of factors that squelch housing markets, see "Real estate horror stories."

|