CNN/Money  
graphic
News > Economy
graphic
Gas prices near record high
Latest survey shows average price up 5 cents a gallon over last two weeks to $1.72 a gallon.
March 10, 2003: 1:19 PM EST

CAMARILLO, Calif. (CNN) - The average price of gasoline increased 5 cents a gallon over the last two weeks, according to a national survey released Sunday.

Americans paid an average of $1.7212 a gallon, less than 1 cent below the all-time high of $1.7271 on May 18, 2001, the Lundberg Survey said. The numbers were not adjusted for inflation.

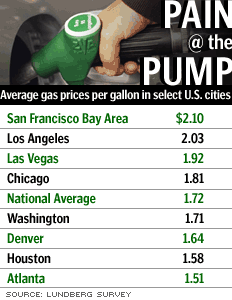
A year ago, the nationwide average price for a gallon of gas was $1.20.

The survey looked at prices at more than 7,000 gas stations in all 50 states and Washington, D.C., Friday.

The lowest price nationwide was in Atlanta, where a gallon of self-serve regular cost $1.51. The highest was in the San Francisco Bay area, where a gallon cost $2.10.

Though the average price of a gallon of gas continues to rise, the rate of increase has slowed after some fairly dramatic hikes earlier this year, the survey found. Average gas prices soared 11 cents between Jan. 24 and Feb. 7, and 7 cents between Feb. 7 and Feb. 21.

Related data
graphic
Gas prices state by state

Part of the reason for the slowed rate of increase can be attributed to the weather, survey publisher Trilby Lundberg said. As the winter season ends, U.S. oil refineries are making less heating oil, which comes from crude oil. The reduced demand for heating oil has freed up more capacity for gasoline production, she said.

The overall increase was affected by sharp spikes in prices on the West Coast caused by California's demands that refineries reformulate gas to meet environmental standards.  Top of page


  More on NEWS
JPMorgan dramatically slashes Tesla's stock price forecast
Greece is finally done with its epic bailout binge
Europe is preparing another crackdown on Big Tech
  TODAY'S TOP STORIES
7 things to know before the bell
SoftBank and Toyota want driverless cars to change the world
Aston Martin falls 5% in its London IPO


graphic graphic

Most stock quote data provided by BATS. Market indices are shown in real time, except for the DJIA, which is delayed by two minutes. All times are ET. Disclaimer. Morningstar: © 2018 Morningstar, Inc. All Rights Reserved. Factset: FactSet Research Systems Inc. 2018. All rights reserved. Chicago Mercantile Association: Certain market data is the property of Chicago Mercantile Exchange Inc. and its licensors. All rights reserved. Dow Jones: The Dow Jones branded indices are proprietary to and are calculated, distributed and marketed by DJI Opco, a subsidiary of S&P Dow Jones Indices LLC and have been licensed for use to S&P Opco, LLC and CNN. Standard & Poor's and S&P are registered trademarks of Standard & Poor's Financial Services LLC and Dow Jones is a registered trademark of Dow Jones Trademark Holdings LLC. All content of the Dow Jones branded indices © S&P Dow Jones Indices LLC 2018 and/or its affiliates.

Most stock quote data provided by BATS. Market indices are shown in real time, except for the DJIA, which is delayed by two minutes. All times are ET. Disclaimer. Morningstar: © 2018 Morningstar, Inc. All Rights Reserved. Factset: FactSet Research Systems Inc. 2018. All rights reserved. Chicago Mercantile Association: Certain market data is the property of Chicago Mercantile Exchange Inc. and its licensors. All rights reserved. Dow Jones: The Dow Jones branded indices are proprietary to and are calculated, distributed and marketed by DJI Opco, a subsidiary of S&P Dow Jones Indices LLC and have been licensed for use to S&P Opco, LLC and CNN. Standard & Poor's and S&P are registered trademarks of Standard & Poor's Financial Services LLC and Dow Jones is a registered trademark of Dow Jones Trademark Holdings LLC. All content of the Dow Jones branded indices © S&P Dow Jones Indices LLC 2018 and/or its affiliates.