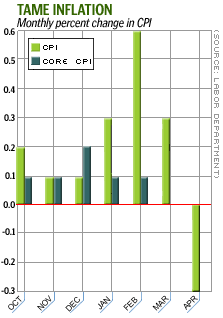
NEW YORK (CNN/Money) - Consumer prices fell in the United States last month by a bigger margin than analysts had expected, according to a government report Friday, potentially fueling more worries about possible deflation in the world's largest economy.
The Labor Department said its consumer price index, the government's main inflation gauge, fell 0.3 percent after rising 0.3 percent in March, while the so-called core CPI, which excludes often-volatile food and energy prices, was flat for the second straight month.
Economists, on average, had expected CPI to fall 0.1 percent and core CPI to rise 0.2 percent, according to a recent Reuters poll.

Separately, the Commerce Department said housing starts tumbled in April to a seasonally adjusted annual rate of 1.63 million from March's pace of 1.75 million. Economists, on average, expected housing starts to fall to a 1.74 million-unit pace, according to Reuters.
The CPI report helped push down U.S. stock prices in early trading, while Treasury bond prices rallied, likely in anticipation of some future cut by the Federal Reserve in short-term interest-rates -- or at least encouraged by the prospect of interest rates on long- and short-term debt staying low for a long time.
Fed policy makers last week said they were concerned about an "unwelcome substantial fall in inflation," and it wasn't certain that the CPI report, combined with Thursday's record drop in the Labor Department's producer price index (PPI), met that definition.
"The markets are trying to put this data in the context of how scared the Fed is by it," said former Fed economist Lara Rhame, now an economist at Brown Brothers Harriman. "It's very difficult to see exactly what the Fed views as a continuation of last year's trend of broadly declining price pressure and what the Fed sees as a substantial decline."
Thursday's dramatic decline in PPI had already fanned the flames of worry about the prospect of deflation, an unstoppable drop in prices that hurts corporate profits and fuels economic weakness.
But many economists noted the PPI decline was due in large part to a sudden drop in oil prices at the end of the war with Iraq -- a drop that was also the culprit behind Friday's CPI decline.
Energy prices fell 4.6 percent in April after jumping 4.6 percent in March. April's decline was the biggest since a 5.1 percent drop in November 2001.
Transportation prices fell 1.7 percent after rising 1.0 percent in March. April's decline was the biggest since a 2.1 percent drop in November 2001.
The fall in transportation prices was driven mainly by an 8.3 percent drop in gasoline prices, following March's 4.1 percent gain.
The price of cars and light trucks also fell, mirroring a similar decline in Thursday's PPI report.
But weakness was not limited to energy and transportation. Apparel prices fell for the eighth straight month, dropping 0.6 percent after March's 0.4 percent decline.
Food and beverage prices fell 0.1 percent after rising 0.2 percent in March. Housing prices fell 0.1 percent after rising 0.4 percent in March.

|

