NEW YORK (CNN/Money) - Your rich Uncle Alan tells you that he'll lend you any amount of money, just ask, and that he'll charge you only a piddling amount of interest. So you take him up on his offer, and with the money you borrowed you buy a 1974 AMC Gremlin that's got more Bondo in it than metal. Price tag: $34,995.
Ridiculous, right? Well, take a look at what's been happening in the stock market, where investors have wholeheartedly embraced the Fed's promise to keep rates nice and low for a good long time by buying everything in sight. And while it was possible earlier this year to argue that stocks were at something like an appropriate valuation, you'd be hard-pressed to call them anything other than expensive at this point.
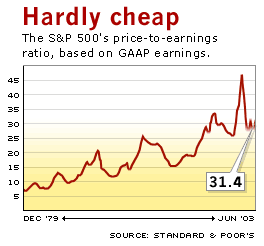
If you look at earnings under generally accepted accounting principles, the S&P 500 is trading a price-to-earnings (P/E) ratio of 31.4, up from 27.5 at the end of March. Before 1998, it had never been above 30. If you are a kind and forgiving person, you can use pro forma earnings -- the numbers that companies post before charges for stuff like plant closings, layoffs, and the like. On that basis, the S&P's P/E is 19.7, a level rarely seen before the gaga years of the late 1990s.

"Valuations are typically higher at the beginning of a recovery, but in this case they've run too high," said Janney Montgomery Scott Vice President Larry Rice. "Whether you're looking at dividend yields or the P/E going forward, we're just stretched."
A way of valuing the market, made popular by Yale professor Robert Shiller, is to look at price compared with average annual earnings over the past 10 years. On this basis, points out AQR Capital Management managing principal Cliff Asness, the S&P's P/E comes in at just under 25. Historically, that P/E has come in at around 14 or 15. Asness thinks that historically stocks have been cheap and that, if investors can accept a lower return environment than they've had in the past, the market can trade at a Shiller P/E of around 21 or 22. As a result, he thinks the market is 10-to-15 percent higher than it should be.
He also notes that, because he is using a P/E implicitly based on trend earnings, the idea that stocks should have a high P/E now because earnings are going to be higher in the future doesn't fly. In fact, he said, if earnings don't recover, things could be "fairly ugly."
Hey Kool-Aid!
Just as disconcerting as how stretched valuations have got is what's rallied most lately -- the same, speculative stuff that not too long ago turned investors stomachs like tequila the day after a three-day bender. Yep, biotechs and dot.coms are back big, baby -- since the beginning of March, the Amex Biotech index is up 42 percent and the Goldman Sachs Internet index is up 54.9 percent.
"There's nothing wrong with what the Fed is doing," said Merrill Lynch chief U.S. strategist Rich Bernstein. "The problem is that when you ease like that in a speculative environment, all that capital gets misallocated."
Bernstein points out that, on a sector basis, the two best performing groups in the S&P have been techs and consumer cyclical stocks. But both groups continue to struggle with the excesses built up during the late 1990s, and are operating far below their potential capacity. Meanwhile, areas of the economy that are running closer to full capacity, like utilities and energy companies, aren't getting much attention paid to them by investors. Ultimately, if one of the functions of the stock market is as a place for companies to raise capital, this is a huge disconnect.
"People are paying Bentley prices for Volkswagens and Volkswagen prices for Bentleys," said Bernstein. "As in the bubble, people ignore the fundamentals."

|

