NEW YORK (CNN/Money) – Your chances of tripping over a millionaire in the United States have gone down.
In 2002, there were 100,000 fewer U.S. millionaires than the year before, according to the 2003 World Wealth report released this week by Cap Gemini Ernst & Young and Merrill Lynch.
But don't cry too much. There are still 2 million left. The survey defines "high net worth individuals" as those with at least $1 million in assets, excluding real estate.
|
 |  | Wealth |  | # of people |  | $1M to $5M | 6.5 million |  | $5M to $10M | 446,000 |  | $10M to $20M | 166,000 |  | $20M to $30M | 44,000 |  | More than $30M | 58,000 |
|  |  |
| Source: World Wealth Report 2003, Merrill Lynch/Cap Gemini Ernst & Young |
|
And though the bear market that sucked the wind (and the nylon) out of your savings sails also dinged the portfolios of high-net-worth individuals, as a group the rich rocked when it came to curbing their losses.
According to the survey, the combined wealth of U.S. and Canadian millionaires (who number about 200,000) fell just 2.1 percent to $7.4 trillion last year. That's the first time in seven years the group experienced a decline in wealth -- hardly a tragedy given that the S&P 500 plunged a whopping 22 percent last year.
The rich played it safe
How did they do it? Well, they had help, of course -- probably pricey help in some instances.

And they played the wealth-preservation game by loading up on highly conservative investments and chanting "Cash is king. Cash is king."
In addition to allocating a great deal of their money into liquid and fixed-income vehicles, they also diversified by allocating money to investments such as real estate investment trusts whose performance is less correlated with equities.
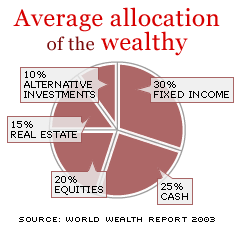
According to the report, the average portfolio of a high-net-worth individual in 2002 looked like this: 30 percent fixed income, 25 percent cash, 20 percent equities, 15 percent real estate and 10 percent alternative investments (e.g., hedge funds).
Worldwide, rich get richer
Rich folk overseas did an even better job managing their money.

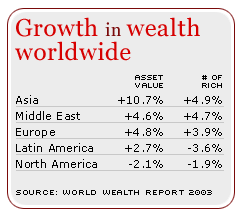
In Asia, the number of high-net-worth individuals rose 5 percent and their combined wealth grew 10.7 percent. In the Middle East, there were 4.7 percent more millionaires, and the group as a whole enjoyed an increase of 4.6 percent in assets.
In Europe, the number of millionaires grew by 3.9 percent and overall wealth rose 4.8 percent. And in Latin America, while the number of millionaires fell by 3.6 percent, the assets of those who remained rose 2.7 percent.
| Related Stories
|

|
|
|
|
Worldwide, the number of millionaires increased 2.1 percent to 7.3 million people, and their combined wealth rose 3.6 percent to $27.2 trillion. How does that nut break down to individual wallets? According to the report, about 90 percent of high-net-worth individuals globally have between $1 million and $5 million apiece.
And the number of "ultra" rich worldwide grew as well. "Ultras"are defined as individuals with more than $30 million in financial assets – they make up less than 1 percent of the high-net-worth pool. But they're gaining ground. Their ranks grew 2 percent to 58,000 people. And their combined wealth grew by about 3.6 percent.

|

