NEW YORK (CNN/Money) - Way back in the 1970s, economists eagerly gathered around their ticker-tape or telegraph machines -- whatever they used to get financial news in those days -- awaiting the Fed's report on the supply of money in the United States.
Back then it was as good a measure as any of the health of the world's largest economy.
But now most economists say money supply doesn't matter as much, in part because bank deregulation has allowed people to liquidate assets more quickly -- meaning the Fed's measures, which date back to the '50s, no longer paint a full picture of how much cash the nation has on hand.

The recent big drop in the growth of money supply is a technical blip, these analysts say, and no cause for concern while the economy's booming. But other experts warn that when this old canary kicks the bucket, it's still telling us something may be wrong with the economy.
"Historically, movements like this have led to a slowdown in economic activity," said Paul Kasriel, director of economic research at Northern Trust in Chicago. "While the relationship between money supply and economic growth has deteriorated, the basic qualitative relationship seems to have held up pretty well, so this is of some concern."
The Federal Reserve has two broad measures of money supply: M2, which is a measure of money available to people in their cash and checking accounts, and M3, which includes household savings and money market accounts, as well as liquid assets of corporations and banks.
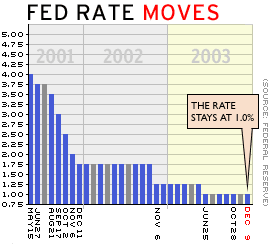
They're gauges of the cash available to the economy, of critical importance to the Fed, the nation's central bank, which has cut its target for a key short-term lending rate to the lowest level in 40 years to make borrowing cheap and pump money into what had been, until recently, a very sluggish economy.
After peaking in August, M2 fell at a 4.8 percent rate through November, while M3 sank at a 4.3 percent annual rate. The three straight monthly declines marked the longest such stretch since late 1992 and early 1993.
| Related stories
|

|
|
|
|
And the Fed's figures show the brakes on money growth have been slammed even harder lately, with declines in M2 and M3 accelerating in the week of Dec. 8, the latest data available.
One possible explanation for this sudden decline is that people are taking cash out of accounts and putting it back in the stock market, which has rallied in recent months, in response to stronger growth in the economy, and corporate profits.
"In the past few years, money supply has moved inversely with stock price movements, and that's probably where the weakness has come from," said David Resler, chief economist at Nomura Securities.
Resler also noted that money supply is more of a problem when there's a big demand for credit. Right now, with corporate profits rising and companies flush with cash, banks aren't lending as much, so a lack of cash in the vaults isn't as much of a concern.
"Nevertheless, money supply contractions are often harbingers of bad times ahead, and if this lasts much longer, people will get more concerned," Resler added.
Room for the Fed wait
Some economists think it might already be time to start paying attention.
For example, Kasriel of Northern Trust disputes that stock-buying has hurt money supply, since stock purchasers aren't just throwing money into the ether in exchange for stocks; they're giving that money to other people.
"All that's happening when I buy stock is that my money supply goes down, while the seller's money supply goes up," Kasriel said.
Morgan Stanley senior economist Bill Sullivan, in a research note Thursday, raised other possible explanations, including the end of the mortgage-refinancing boom, which has curbed the flow of cash into temporary bank accounts, which are used to pay off holders of mortgage-backed securities, and super-low interest rates that have turned investors away from money-market accounts.
But he also noted that similar pressures have been present in other business-cycle expansions, without crippling money supply. The supply of money did just fine, for example, in the late 1990s, when stocks rose at an exuberant pace.
He suggested it would be unwise to ignore money supply's historic role as a leading indicator, one that's still included (albeit in a different form) in the Conference Board's monthly index of leading economic indicators..
"From that perspective alone, the current pattern of money supply weakness deserves scrutiny, particularly if the erosion persists into the new year," Sullivan wrote. "Essentially, the longer the pattern lasts, the greater the economic impact of this erosion."
The drop in money supply growth could also help keep the Fed on hold.
Though consumer prices are rising at the slowest pace in decades, some analysts see inflation brewing and are clamoring for the Fed to raise its target for the fed funds rate, currently at 1 percent, to slow down money growth and head inflation off at the pass.
A 1 percent fed funds rate should only be maintained in an emergency, these analysts say, adding that the economy can grow just fine even if the rate gets raised to 2 or 3 percent.
But if money-supply growth is already anemic, meaning the value of the fewer dollars in circulation is either stagnant or growing -- which is the opposite of inflation -- then keeping rates low isn't as dangerous as some "inflation hawks" think, Merrill Lynch chief North American economist David Rosenberg said in a recent research note.
"What [all this] spells is inflation from barely 0 percent all the way up to something that doesn't even make it to 2 percent," Rosenberg wrote. "This is an easy money policy?"

|

