NEW YORK (CNN/Money) -
Consumer confidence took a breather this week, holding steady a week after its first significant gain since January.

The ABC/Money magazine Consumer Comfort Index -- which measures American's views on the current economic climate -- stands at -17 on its scale of +100 to -100. The index started the year with momentum, topping out in mid-January at -3, a 21-month high, after a late 2003 rally.
The descent from there, including a record-matching one-week drop of seven points in February, came amid rising gasoline prices and lingering questions about jobs. One part of that equation may be changing as the government reported Friday the largest monthly increase in new jobs in four years.
Here's a closer look at the three components of the ABC/Money index:
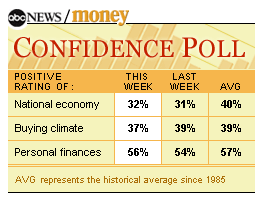
Thirty-two percent of Americans rate the nation's economy as excellent or good, up modestly from 31 percent the week prior. The highest level of confidence in this category was set at 80 percent on Jan. 16, 2000, while the lowest levels, 7 percent, occurred in late 1991 and early 1992.
Fifty-six percent of respondents rate their own finances as excellent or good, rising from 54 percent the previous week. Consumers reported their highest level of confidence for this category, 70 percent, on August 20, 1998, which was last matched in January 2000. The lowest level of confidence was set at 42 percent on March 14, 1993.
As usual, confidence is higher among better-off Americans. The index is +8 among higher-income people while -59 among those with the lowest incomes.
YOUR E-MAIL ALERTS
|
Follow the news that matters to you. Create your own alert to be notified on topics you're interested in.
Or, visit Popular Alerts for suggestions.
|
|
|
 |
A vast partisan gulf remains as well, with Republicans at +35 and Democrats and independents both at -36.
The survey's buying gauge, which measures consumers willingness to spend, slipped as 37 percent said it was an excellent or good time to buy things they want or need, down from 39 percent the week prior. Americans were most willing to part with their cash on Jan. 16, 2000 when the spending gauge peaked at 57 percent and least likely in the fall of 1990 when the numbers bottomed out at 20 percent.
The ABC/News Money magazine Consumer Comfort Index represents a rolling average based on telephone interviews with a random sample of about 1,000 adults nationwide each month. This week's results are based on 1,000 interviews in the month ending April 4, 2004, and have an error margin of plus or minus three percentage points.

|

