NEW YORK (CNN/Money) The eyes of car enthusiasts will be on Detroit this week for the industry's annual North American International Auto Show.
Those who favor performance vehicles probably won't be looking to Toyota to satisfy their needs. But while Sienna minivans and the hybrid Prius won't fit that bill, Toyota's stock has shown some impressive pick up.
Shares of Toyota (Research) were up a healthy 20 percent in 2004 while DaimlerChrysler's (Research) stock rose only 5 percent and shares of General Motors (Research) and Ford (Research) both fell.
Toyota is now the world's No. 2 automaker, in terms of vehicles sold, and could surpass long-time No. 1 General Motors before the end of the decade.
More important to investors, Toyota enjoys competitive cost advantages that allows it to build vehicles at its U.S. plants for thousands less per car or truck than the traditional Big Three. That's a main reason why Toyota's stock outperformed its rivals for the last several year.
Still, there could be some bumps in the road for Toyota as it tries to make up the remaining ground between itself and its U.S. competitors. The weaker dollar reduces the value of its U.S. sales and increases the comparative costs of the parts and vehicles it imports from Japan.
So are shares of Toyota worth a test drive?
Big Three playing catch up?
Toyota has steadily gained market share in the U.S. during the past decade. It is challenging DamlerChrysler's Chrysler Group for the No. 3 spot in terms of U.S. sales. And Toyota's Camry is already the best-selling car model in the U.S.
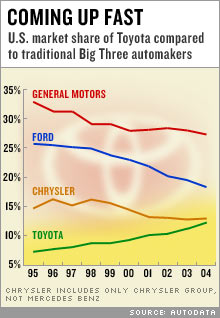
More efficient production and the perception among auto buyers that Toyota simply makes better cars are two main reasons behind Toyota's surge.
But the U.S. automakers have started to narrow the productivity gap between their plants and the plants of Toyota and the other Asian automakers building vehicles here. Estimates from the Harbour Report, which tracks auto plant productivity, show that GM takes less than four man-hours more than Toyota to build a vehicle in North America. That's less than half the gap of several years ago. And the Big Three vehicles are seeing improved quality ratings as well.
Still, analysts say the productivity gains being made by the U.S. automakers can only close some of the cost gap, even if they become as efficient as Toyota's generally newer assembly plants. That's because Toyota has a younger North American work force (which means lower insurance costs) than the Big Three and also has significantly lower pension and retiree health care expenses -- about $1,000 per vehicle.
Weak dollar not a huge worry
Sure, there's more to Toyota than the U.S. market. The majority of its sales come from outside North America, which helps protect the company from a weak dollar. Also protecting the company from currency woes is the fact that more than half the cars Toyota sells in North America are built here.
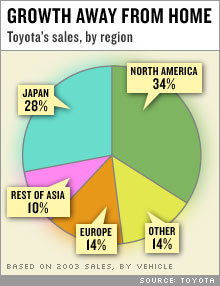
But Toyota is seeing its greatest growth opportunities outside the U.S. and its native Japan, two maturing markets. Toyota posted about 3 percent growth in Japanese sales last year and 10 percent growth in U.S. sales. But growth elsewhere in the world was roughly 15 percent.
Toyota is making stronger inroads into the more unified European market than it was able to do before many national barriers started to come down. And it is joining U.S. automakers in making significant investment into China, which became the third largest national market during the last year.
Nonetheless, Toyota still sees somewhat slower overall growth going forward. The company projects 8 percent growth in vehicle production in 2005, down from the 11 percent growth it expects to report for 2004. But few other automakers saw even that more modest growth level in 2004. GM's global sales were up only 3 percent in the first three quarters of 2004.
Running out of gas?
Investors willing to get behind the wheel of Toyota's stock aren't likely to lose their shirt. But it may be like taking a drive in a Corolla, an efficient but relatively unexciting ride.
Toyota trades at what seems to be a relatively modest valuation of 11.5 times earnings estimates for fiscal 2005. But GM and Ford trade at single-digit P/E ratios. So the pressure will be on Toyota to keep gaining market share and posting stronger earnings gains in order to justify this premium.
Sure, Toyota may be the best company in the sector, but it is pricey for an auto stock. And auto stocks are still a turnoff for many investors, limiting the upside in the price.
There isn't likely to be a tech-like bounce in a sector that is known to be particularly susceptible to any declines in consumer confidence or a slowdown in the overall economy.
And despite its successful track record, Toyota certainly isn't immune from mistakes. It took several cracks at entering the minivan, SUV and pickup markets in the U.S. before it had hits. Some analysts worry that as it gets bigger, it will become more prone to the kinds of mistakes that tripped up the Big Three.
If any of the bumps ahead do cause problems for the company, Toyota's stock could quickly wind up stuck in neutral.

|