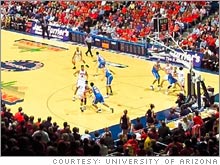
Nothing but net
Arizona is the dollar leader in this year's NCAA tournament, as big profits are a slam dunk for most major conference basketball programs.
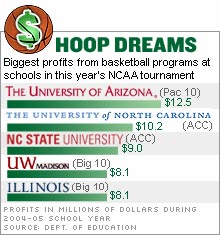
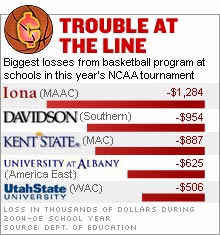
NEW YORK (CNNMoney.com) - The University of Arizona may be out of the NCAA men's basketball tournament after just two rounds. But it is still the biggest winner in this year's brackets, at least in terms of the bottom line. According to reports filed with the Department of Education by most every school in the tournament, the No. 8 seed Arizona Wildcats are the tops in both revenue and profits for the 2004-05 school year, the most recent year for which figures are available.
Arizona had revenue of $16.6 million and a profit, after reported expenses, of $12.5 million. That gave it a 75 percent profit margin that would be the envy of any CEO. Arizona athletic department spokesman Tom Duddleston said that team's financial ranking is only a surprise because its 14,000-seat arena is smaller than some other top basketball program's homes. But the team has had nearly 20 years of sell outs, a cable television deal that puts all its games not televised nationally or regionally on local cable, and courtside seats that can go for up to $30,000 a pair for the season. "The model here is a great model. It's budgetable money you can count on, even in the less successful years," Duddleston said. The second round exit is not that big a surprise, though. Dollars aren't much of a predictor of on-court results as the brackets narrow. The programs with the smaller revenue, expenditures, profits or profit margins won only about one-third of the match ups in the first round of the tournament. But the dollar underdogs won about half the match-ups in the second round games over the weekend. By comparison, only 5 of 16 underdogs based on seeding won Saturday and Sunday. The biggest upset over the weekend in terms of the school's revenue disparity was also among the biggest upset in the eyes of hoop analysts and fans: George Mason University, with just over $1 million in revenue, knocking off the defending champion University of North Carolina, the No. 2 school in the country in terms of both revenue and profit. Arizona' exit from the tournament wasn't a terribly big surprise for those looking at on court performance rather than dollars, but it's the next biggest upset when weighing financial wherewithal. No. 1 seed Villanova had revenue of only $4.2 million, and a profit of only $1.6 million. That left Villanova with only a 38 percent profit margin, a bit below the combined 45 percent profit margin for the 64 tournament teams that report results (Air Force is exempt from reporting). Together those schools had a combined $330.8 million in revenue during the 2004-05 school year, and $148.3 million in profits, even when including results from the 14 money-losing basketball programs involved in March Madness. Based on those numbers, basketball is more of a sure money maker for schools than college football -- at least for the schools in the so-called six major conferences. In fact, about half of the schools in this year's Big Dance come from the ACC, Big East, Big Ten, Big 12, Pac Ten and SEC. And these major conference schools account for 84 percent of the total revenue and about 97 percent of the total profit of all the schools in the tournament. Only one major conference school in this year's tournament -- Big East's Georgetown -- reported a loss from its basketball program last year. By comparison, about two-thirds of the non-major conference teams in the tournament either lost money or essentially broke even on their basketball programs last year. Put together they had only $4.9 million in reported profits, less than half of what the Arizona basketball program earned. The more than $400 million that CBS will distribute to the NCAA this year for the men's tournament will go to the conferences based on the number of games played by their schools in the tournament over the past six seasons. The conferences then distribute the money to the schools. So even a losing school from a successful conference will get to cash a big check, likely a much bigger check than a school that dominates a small conference. That's why while a school like Gonzaga University, which has gone from Cinderella status to established power on the court in recent years, still wears rags away from the hardwood. The only West Coast Conference school in the tournament, its revenue was just $2.5 million last year, which ranked it as the No. 39 school in this year's field, and well behind all the major conference schools in the tournament. Memphis, the only No. 1 seed not from a major conference, wasn't in all that much better financial shape than the two small-conference teams it has beaten so far - Oral Roberts and Bucknell. _________________________ For SI.com's coverage of this year's NCAA tournament, click here. For a look at the most profitable college football teams, click here. For a look at CBS' Internet hoop dreams, click here.
For more news on the business of sports, click here. |
| |||||||||||||||