|
An investor road map for the 2nd quarter
History says it may be tough. Between Fed meetings, earnings and seasonal issues, here's what's cooking.
NEW YORK (CNNMoney.com) - It's hard out here for a bull. With speed bumps, flashing yield signs and the occasional bear crossing the road, the second quarter of 2006 promises to be a jarring place on Wall Street.
Expect some choppiness, especially after blue-chip stocks chalked up their best first quarter in seven years, and with the Nasdaq at a five-year high. Why? One reason is that the second year of a presidency tends to be the worst for the market, according to the Stock Trader's Almanac, as the commander-in-chief enacts tougher parts of his economic agenda without yet worrying about the next presidential election. 2006 is that year, and the second quarter is usually weak; only the third quarter is worse. Over the last 60 years, on average, the S&P 500 has fallen 2 percent in the second quarter of the second year of a president's term, according to Standard & Poor's research. (Full Story). Other factors to watch include the Fed, which is still raising interest rates, oil prices back near record highs, gold near a 25-year high, and long-term Treasury bond yields on the rise as investors bet that higher rates, and possibly slower economic growth, are ahead. But hey, it's not all bad. April is typically a strong month. No fooling. Here's a road map of sorts, with some of the things to look out for in the next three months. April: last of the best
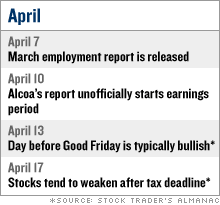
For blue chips, April is often the end of the "best six months of the year," according to the Almanac. -- April is the best month for the Dow industrials, good for an average gain of 1.8 percent since 1950, the Almanac says. It's also pretty good for the other major gauges. S&P has risen an average 1.3 percent since 1950, while the Nasdaq composite's gained 1.1 percent since its inception in 1971. -- First-quarter earnings start pouring in around mid-month. Anticipation about this tends to drive stocks higher. Analysts expect first-quarter S&P 500 earnings will rise 11.3 percent from a year ago, according to Thomson Financial, making the 11th consecutive quarter of growth of at least 10 percent. -- But the second half of the month is less bullish than the first, with investors tending to back out after the income tax deadline. -- April also starts a seasonally bullish four-month period for healthcare stocks, computer makers and Internet companies. And oil and natural gas producers, as well as Wall Street brokerage houses, all tend to do well. May: feast or famine
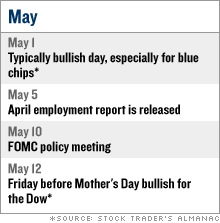
If April caps a period of strength, May begins the worst six months of the year. In other words, you may want to "sell in May and go away," as the old Wall Street saw goes. (Full Story). -- May and June both were painful from the mid-1960s until the mid-80s, the Almanac says, but better from then until the mid-90s. Since then it's been volatile. Overall, May is a good month for the S&P 500 -- it's posted an average gain of 1.8 percent since 1950, but it's not as good for the Dow or the Nasdaq. -- By May, a majority of first-quarter earnings will have been reported. While analysts expect strong results, that doesn't always do much for stocks -- investors buy on the forecasts and then sell once the news is out. Then there's the second quarter, when earnings growth is expected to dip below 10 percent, according to Thomson Financial. -- May also brings the next Fed meeting. It's almost a universal belief on Wall Street that the central bank will boost its key short-term interest rate a quarter-point to 5 percent. But there's substantial debate about what the Fed will do after that. Some worry the central bank will raise rates too high in a bid to cool the economy and ward off inflation. So this meeting will be crucial. June: blue-chip gloom
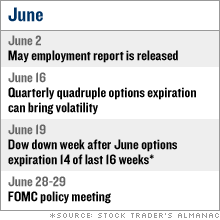
Tech shares, and therefore the Nasdaq, tend to do better than their blue-chip brethren in June. -- On average, the Nasdaq has risen an average of 1.2 percent in June since 1971. The Dow and S&P 500 have barely risen at all in the month, on average, since 1950. In the second year after a presidential election, like 2006, the S&P 500 sees its worst month in June, according to the Almanac. -- By June, first-quarter earnings are out, but second-quarter pre-announcements have not started to pour in earnest. This year there's no Fed meeting until the end of the month, so June has less potential market catalysts, at least on the surface. -- June, July and August tend to be impacted by weaker stock trading volume, as investors would rather be on the beach than at their desks. This period of light volume tends to bring more volatility -- and more potential for losses. -- June also ends a bullish season for several sectors, the Almanac said, including oil, natural gas, healthcare providers, consumer and banking stocks. On the upside, stocks that were strong in April, such as computer makers and Internet service providers, should again do well. _________________ Market watchers say the next six months could be tough. Why? Click here. For a look at how to profit in the expected stock market storm in 2006, click here. What's ailing big cap stocks in 2006? Click here.
For more on the markets, click here. |
|


