|
Uh oh. Here comes September As if investors don't have enough to handle, get ready for what's typically the worst month of the year. NEW YORK (CNNMoney.com) -- They don't call it the cruelest month for nothing, and no, they aren't talking about April. Apologies to T.S. Eliot fans, but on Wall Street, traders know September is the cruelest month.
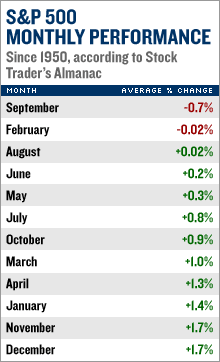
According to the Stock Trader's Almanac, September has the dubious distinction of being the worst month of the year for all three major gauges: the Dow industrials, the S&P 500 and the Nasdaq composite. Since 1950, the Dow has fallen an average of 1.1 percent in September, while the S&P 500 has fallen an average of 0.7 percent, according to the Almanac. Over the past 16 years, September is only the second-worst month, after August. Since its inception in 1971, the Nasdaq has seen an average decline of 1 percent in the month. September 2006 is unlikely to break the trend, what with a few other issues you may have heard about already dragging on stocks. Investors have been preoccupied lately with worries about the economy slipping into recession amid the rapidly cooling housing market and its impact on consumer spending. Such a scenario would ultimately hurt corporate profits and drive up stock prices relative to earnings. At the same time, if inflationary pressures don't start to wane, the concern is that the Federal Reserve might have to restart its recently paused rate-hiking campaign. Those worries aren't bound to disappear in the month ahead, as investors continue to pounce on any economic report dealing with growth or inflation, particularly leading up to the next Fed policy meeting Sept. 20th. But now Wall Streeters have to take an additional lump: the start of what has historically been the worst month of the year for stocks. Granted, history says July and August are typically not very good months, either, but it's September that holds the most dubious record. Housecleaning Why is September so troublesome for stocks? Partly it's the whole back-to-school mentality, even for adults. Summer is typically lightly traded, with investors more interested in working on their tans than making changes to their portfolios. But in September, it's back to work, and for many money managers that means shedding losers before the end of the third quarter. That reshuffling is intensified by the fact that many mutual funds close out their fiscal years at the end of September. September is also the last month of the quarter, which means little in the way of earnings reports or pre announcements. Plus, those who think the market follows the four-year cycle of the presidency will tell you that the second year of a presidential term is the worst. 2006 is year two. An unusually strong August this year makes September - and its partner in crime, October - even more vulnerable to profit taking. As of Tuesday's close, the Dow has gained 1.6 percent in August, the S&P 500 has gained 2.2 percent and the Nasdaq composite has gained 3.9 percent. August is typically the third-worst month of the year for the major gauges. But after nearing five-year highs in May, the major gauges slumped through June, waffled in July and then recovered in August. This has led some to question whether the market has already had its typical third- to fourth-quarter sell-off and whether September and the fall generally won't be so bad. Maybe, but that's unlikely. Typically the end of rate hikes has brought stock declines in the six to 12 months that follow. And, according to the Almanac, the market has on average fallen 22.2 percent between its high in year one of the presidential cycle and its low in year two. Since peaking in March 2005, the Dow is actually up almost 4 percent, suggesting a big sell-off is due this fall. Watch out. Worst of the worst of the worst |
|


