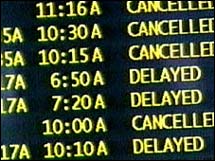
Report: 42 years of flight delays in '06Newspaper says record 22 percent of flights were delayed 15 or more minutes, with total delays reaching 22.1 million minutes.NEW YORK (CNNMoney.com) -- Airline delays increased sharply to record levels in 2006, according to a published report. USA Today reports that 22 percent of flights were delayed 15 or more minutes during the course of the year. The Department of Transportation reports that just under 20 percent of flights were delayed in 2005.
The paper said that DOT statistics show total delays reached 22.1 million minutes during the year. That's the equivalent of just over 42 years of delays. But passengers seem to be more accepting of the delays, according to the paper. There were only 1,972 complaints to the federal government about airline delays through October, well below the 9,235 seen in 2000. The paper reports that New York's three airports led the nation in the percentage of late flights through November, according to the federal data. At Newark, the paper reports, a third of arrivals on major airlines were at least 15 minutes late. As in the past, weather was the major cause of the delays. The year ended with snowstorms that closed Denver's airport for the two busy travel days before Christmas. But the paper reports that increased air traffic is also making the system more vulnerable to delays. "The air-traffic control system is under stress because of the demand and unusual weather," Massachusetts Institute of Technology aeronautics professor John Hansman told the paper. "The airline system is under stress because of the high load factors and the economic pressures." Air Transport Association President Jim May told the paper the rise in delays highlights the need for new technologies. "It inevitably is going to get worse because of the demands on a system that is at capacity," the head of the industry trade group said. DOT's Web site shows that among the nation's 20 largest carriers through November, feeder airline Atlantic Southeast Airlines had the worst percentage of flights delayed 15 minutes or more, at 34 percent. The airline, a unit of SkyWest (Charts), flies primarily under the Delta Connection name. Among the nation's major airlines, Continental Airlines (Charts) had the largest percentage of flight delays at 27 percent. It is the largest carrier at Newark, which is the airport with the worst delays. Hawaiian Airlines (Charts) has the best on-time performance, with only 6 percent of flights delayed, followed by competitor Aloha Airlines at 10 percent. Among the major carriers, the best on-time record is Southwest Airlines (Charts). The DOT Web site shows 19 percent of its flights were delayed. |
Sponsors
|

