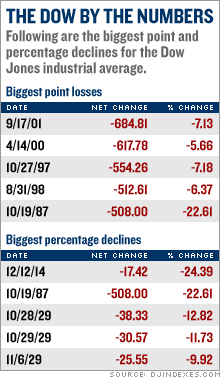
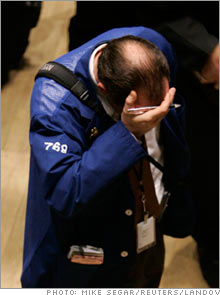
Brutal day on Wall StreetDow tumbles 416, biggest one-day point loss since 2001, as investors eye China, drop in durable orders.NEW YORK (CNNMoney.com) -- The stock market tumbled Tuesday in a selloff sparked by worries about economic growth at home and abroad, sending the Dow industrials to their biggest point drop since the day the market reopened after the Sept. 11 attacks. A big decline in Chinese stocks, weakness in some key readings on the U.S. economy and news that Vice President Dick Cheney was the apparent target in a Taliban suicide bombing attack in Afghanistan all fueled the selling on Wall Street.
 The Dow Jones industrial average (down 416.02 to 12,216.24, Charts) tumbled 416.02 points, the biggest point loss since Sept. 17, 2001, when the 30-share tumbled nearly 685 points. It was the seventh biggest one-day point ever for the Dow. On a percentage basis, the Dow lost about 3.3 percent. The broader S&P 500 (down 50.33 to 1,399.04, Charts) index fell about 3.5 percent - its worst one-day percentage loss since March 2003. The Nasdaq (down 96.66 to 2,407.86, Charts) composite tumbled 3.9 percent in its biggest percentage drop since early December 2002. Treasury bonds rallied as investors sought a safe place to park their money while the dollar fell. Oil prices inched higher and gold tumbled as traders bet that slower growth in China would put less upward pressure on commodity prices worldwide. "The selloff demonstrates somewhat starkly the inter-connectedness of stock markets around the world," said Hugh Johnson, chief strategist at ThomasLloyd Global Asset Management. "Markets can decline in one seemingly isolated part of the world and that decline can be transmitted to other parts of the world through the psychology," he said. The slump in world markets exacerbated concerns that Wall Street is due for a selloff after a nearly eight-month rally that has sent the Dow industrials to record highs and the Nasdaq and S&P 500 to more than 6-year highs. Market veterans have been looking for a stock selloff for some months now due to the combination of slowing economic and earnings growth expected this year, said Harry Clark, CEO at Clark Capital Management. Trying to limit the declines, the New York Stock Exchange said it imposed trading curbs at around 1 p.m. ET with the Dow off about 200 points. But then briefly, just before 3 p.m., the Dow appeared to abruptly drop sharply, sinking another 200 points, to show a decline of 546 points. But the drop came partly from a computer glitch due to heavy trading volume, according to a Dow Jones spokesman. Although some analysts have been calling for a pullback of about 10 percent for the market, Clark said a smaller drop is more likely. "We'll probably see a decline of about 4 or 5 percent and then it will be done," Clark said, noting that a lot of the selling will be washed out within the next week or so as the shock wears off. ThomasLloyd Global's Johnson agreed that the selling should ease. But markets will "continue to be vulnerable to big decisions by big policy-makers in big places like China," he said. Additionally, the Russell 2000 (down 31.03 to 792.66, Charts) small-cap index lost almost 3.8 percent, while the Dow Jones Transportation (Charts) average lost 3.4 percent. The selling started overseas when a key gauge of Chinese stocks slumped 8.8 percent in Shanghai Tuesday - the worst one-day selloff in a decade - on concerns that the government would interfere to cool the speculation that drove the market up nearly 130 percent last year. (Full story). Other Asian markets slumped in tandem. European shares also tumbled. A morning report in the United States then showed a steeper-than-expected decline in durable goods orders in January, adding to concerns about slowing economic growth. Slowing growth ultimately drags on corporate profits, making stocks more expensive relative to earnings. For more on the day's economic news including the latest on the housing market, click here. Among individual issues, all 30 components of the Dow Jones industrial average fell. The biggest decliners were Alcoa (down $1.57 to $33.79, Charts), Caterpillar (down $2.43 to $64.83, Charts), Citigroup (down $2.08 to $50.60, Charts), Walt Disney (down $2.01 to $33.10, Charts), General Motors (down $1.82 to $32.15, Charts), Procter & Gamble (down $3.19 to $61.25, Charts) and Exxon Mobil (down $3.57 to $71.83, Charts). The S&P 500's biggest decliner was Freeport-McMoran Copper and Gold (down $6.17 to $55.75, Charts), which lost just short of 10 percent. It was one of a number of gold stocks that slumped on the session, contributing to a decline of 7.5 percent for the Amex Gold Bugs (down $27.10 to $334.72, Charts) index. Freeport was one of 498 stocks in the S&P 500 that declined. The lone standouts to the upside: natural gas producer Questar (up $1.18 to $82.95, Charts), which released positive test results and gained 1.4 percent, and RadioShack (up $2.68 to $25.13, Charts), which reported higher-than-expected earnings and surged 12 percent. In other news, Apple Computer (Charts) declined after it said late Monday that its Apple TV will be delayed until mid-March. Nordstrom (down $4.30 to $52.30, Charts) slipped after reporting weaker-than-expected fourth-quarter financial results. Market breadth was negative On the New York Stock Exchange, decliners trounced advancers by almost six to one on volume of 2.34 billion shares. On the Nasdaq, losers beat winners by more than nine to one on volume of 3.06 billion shares. In addition to the durable goods report, the morning brought the latest on housing and consumer confidence. Existing home sales grew at a faster-than-expected pace in January, in a report that also showed the pace of sales dropped from a year ago. The median price of a home sold in January was down versus a year ago. (Full story). Another report showed that consumer confidence saw a surprise rise in February versus forecasts for a drop. Investors were also still digesting Monday reports that former Federal Reserve Chairman Alan Greenspan says the economy could fall into a recession by the end of 2007. (Full story). Tuesday kicked off a busy week for economic news, with reports due later in the week on fourth-quarter gross domestic product growth, new home sales, personal income and spending and the manufacturing sector. Also impacting the market Tuesday: news of a suicide bombing attack at the entrance to the main U.S. military base in Afghanistan during a visit by Dick Cheney. The attack killed at least 23 people. (Full story). In Iraq, a bomb that exploded near a soccer field killed 18 children and wounded at least 25 others. Treasury prices rallied as investors sought safety, lowering the yield on the benchmark 10-year note to 4.51 percent from 4.62 percent late Monday. Treasury prices and yields move in opposite directions. In currency trading, the dollar fell versus the euro and the yen following the durable goods orders report. U.S. light crude oil for April delivery rose 7 cents to $61.46 a barrel on the New York Mercantile Exchange. The price of oil rose for the last four sessions. COMEX gold for April delivery fell $2.60 to settle at $687.20 an ounce. The next YouTube: 25 startups to watch |
|


