Wall Street's other record breakerThe Dow industrials get all the hype, but the S&P 500 is gunning for a new record, too. Here's why it matters.NEW YORK (CNNMoney.com) -- Dow! Dow! Dow! Why is it always about the Dow? True, the Dow Jones industrial average (Charts) has been enjoying its longest up streak in 80 years and has chalked up 20 record closings in 2007 alone, after first taking out its all-time high from 2000 more than six months ago. And, yes, the Dow is arguably the most famous U.S. stock index, watched and spoken of around the globe. But like an actor who always plays a version of himself in the movies, the Dow's range is narrow, just 30 stocks.   
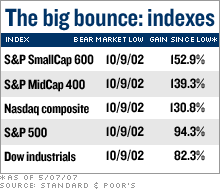
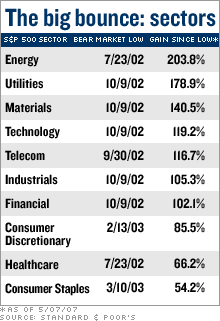
Meanwhile, the far more versatile S&P 500 (Charts) index has been quietly inching closer to topping its all-time closing high of 1527.46 hit on March 24, 2000, at the end of the big rally sparked by the 1990s tech boom. It's not even 20 points away. And, no 30-trick pony, the S&P 500 contains ... the 500 largest publicly traded U.S. companies. It's also the index most widely watched by Wall Street professionals. So if or when the S&P 500 finally joins the Dow in making new records, why does it matter? For one thing, it matters just because it's a broader index, said Jeff Kleintop, chief market strategist at Boston-based brokerage LPL Financial. Because the S&P 500 is broader, a new record for the index might be sufficient to encourage a new wave of individual investors. He pointed to the fact that while institutional investors have been driving the market higher of late through stock buybacks, deals and other transactions, individuals have been pulling money out of the market. That's been evidenced by outflows over the past month to mutual funds that invest in U.S. stocks. "I think that may be starting to turn around," Kleintop said. The new highs could be the catalyst that returns individuals to the market, which could mean a lot more inflow of cash going forward, he said. There is also the risk of investors using that milestone as a prompt to take some profits after the run, analysts said, at least in the short term. "Short term, I think there is the potential for a pullback based on automatic selling," said Mark Arbeter, chief technical strategist for Standard and Poor's. He said that program selling often kicks in when an index or individual stock hits a record again. But, regardless of the short-term reaction, the S&P 500 record is really just another sign that the four-and-a-half-year-old bull market is still hanging in there. "I think it's important for individual investors because it means we're finally putting the whole bear market of 2000 to 2002 behind us," Arbeter said. The late 1990s tech boom led to the major gauges topping out in March 2000, followed by a three-year bear market that encompassed a recession, 9/11, the wars in Afghanistan and Iraq and a spike in oil prices. Most market watchers consider October 2002 to have been the bottom in that particular bear market. Since then, the stock market has seen a broad-based recovery, with all of the S&P 500's sectors participating, Arbeter said. (See chart for details.) The technology sector has recovered, too, helping the Nasdaq composite climb more than 130 percent from its bear market bottom. (See chart.) But the tech-driven Nasdaq composite (Charts) remains far below its March 10, 2000, record close of 5048.62. Analysts say it may never top that high. Why? Take heavily traded Nasdaq stock Sun Microsystems (Charts, Fortune 500), for example. On March 10, 2000, it closed at $94.19. On Tuesday, it closed at $5.22. Ahem. The market recovery off the bottoms has been attributable to a recovery in the U.S. economy following the recession, accommodative Federal Reserve interest rate policy, improved quarterly earnings and a global economic expansion. That global expansion is the main reason why the stock market can probably continue its rise, even as U.S. economic growth is at a four-year low, said Walter Gerasimowicz, chairman of Meditron Asset Management, a NY-based money manager and hedge fund operator. He said the global economic expansion between 2004 and 2007 has been the fastest in 30 years and that its a big part of what's been driving the rise of the global equity markets in unison. To be sure, he too cautions that U.S. stocks could be due for a pullback in the short term, particularly should the U.S. economic slowdown accelerate over the next year or two. Looking forward, the question will be whether the ongoing slowdown is going to have "cross border implications and whether global economies can un-tether themselves from the U.S. growth engine," Gerasimowicz said. He said he thinks global economies and global stock markets are unlikely to move separately. The interconnectedness of global stock markets was evidenced as recently as late February, when a sell-off in Shanghai markets quickly spread around the world. However, he said that these connections will also help U.S. stocks, even as the U.S. economy is struggling. "That broad participation [in equities] remains strong," Gerasimowicz said, "And there's farther to go." |
|
