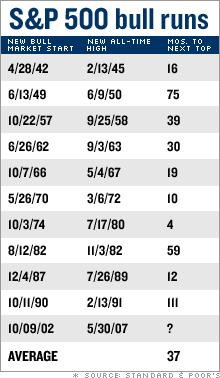
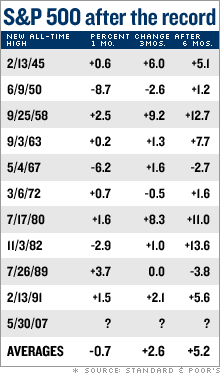
Don't sweat the selloffSure, the summer could be choppy, but longer term, the outlook is better, says a new study of the S&P 500.NEW YORK (CNNMoney.com) -- Tuesday's selloff could be a harbinger of a choppy summer on Wall Street. But don't let it make you think the stock market is done hitting record highs this year. According to a recent Standard & Poor's study, more records may be brewing over the next couple of years - if history is to be trusted.   The S&P 500 (Charts) finally snapped its seven-year-old record high from March 2000 last week. And although it was with decidedly less fanfare than when the Dow Jones industrial average first started setting records last fall, the implications are just as relevant for the rally. Standard & Poor's chief market strategist Sam Stovall took a look at how the S&P 500 performed in the aftermath of having broken an all-time high, examining the previous 10 bull markets dating back to the 1940s. (See chart for details). His research found that despite expectations to the contrary, it was not all downhill right after the S&P 500 hit its new high. He found that the S&P 500 usually had a ho-hum first month after hitting a record, but ended up seeing better-than-expected returns in the next three to six months. (See charts). In addition, each of the 10 bull markets didn't hit a so-called "top" until an more than three years after the S&P 500 first hit that all-time high, on average. That's not to say the current bull market won't top out for another three years - it is getting quite old, if history is any guide - but it does help temper worries that on a technical level, the S&P 500 is near its top. The new record is also important in that "pretty much anyone who invested in the S&P 500 at any point in time is now sitting on a profit," said Mark Arbeter, chief technical strategist at Standard and Poor's. "That is, assuming the person sat through the entire period." Granted, the profit would be minimal for an investor who bought an index fund after the previous closing high in March 2000, as the S&P 500 today just stands a few points above that point. At a little over 4-1/2, the current bull is about a month older than the historic average, at least by Standard & Poor's calculations. The bull run has been in place since October 2002, after a three-year bear market following the late-1990s tech boom. The age of the current bull market is one of many reasons investors have been concerned that stocks could be due for a bigger pullback, despite the positive factors that continue to buoy the market. Those include better-than-expected earnings, the ongoing flow of money into the market from private equity and other deal makers, corporate stock buyback plans, and solid economic growth. Until very recently, a sense that the economy is strong but not too strong could have been added to that list. Yet in the first few sessions of June, investors have grown concerned that the growth may be picking up too quickly after hitting a five-year low in the first quarter. That could cause a renewed pickup in inflation, and force the Federal Reserve to start raising interest rates again. Higher rates tend to slow growth and crimp earnings - clear negatives for stocks. But some analysts say there are enough positives in the market that any selloff will be short-lived, and used as by investors to get back in at lower levels. And the S&P 500 finally recouping its losses from the three-year bear market would seem to strengthen that resolve on the part of many investors. But what does the new record say about market psychology? It's certainly good for sentiment that two of the market's Big Three are near record highs. But what about the Nasdaq composite (Charts)? The Dow Jones industrial average closed at a record high Monday for the 27th time this year and the 49th time since October 2006, according to Dow Jones. After first breaking its record on May 30, the S&P 500 closed at records for the next three sessions through Monday. Even the Russell 2000 (Charts) small-cap index ended Monday's session at a new record. Meanwhile, the tech-fueled Nasdaq composite is still 48 percent below its all-time closing high of 5,048.62 set March 10, 2000, making it clear that not all areas of the market have participated fully in the comeback. Still, S&P's Arbeter said the scope of the recovery has been broad, even if it has been less tech-driven than the late 1990s rally. He noted that all different asset classes have participated, and the advance has been driven by investors both here and abroad. His biggest concern on a technical level is that if the market rises too quickly over the next six months, too many individual investors would be tempted to jump back in, and as any contrarian can tell you, that's usually the beginning of the end. On one hand, AMG mutual fund data suggest that individuals are starting to put more money back into stock mutual funds. But on the other hand, the level of bullishness of Wall Street pros is still ahead of that of the individual, Arbeter said, and historically, that's been important. |
|
